Reports and DashboardsOne-click Interactive
Clear insights with
Visual Reports
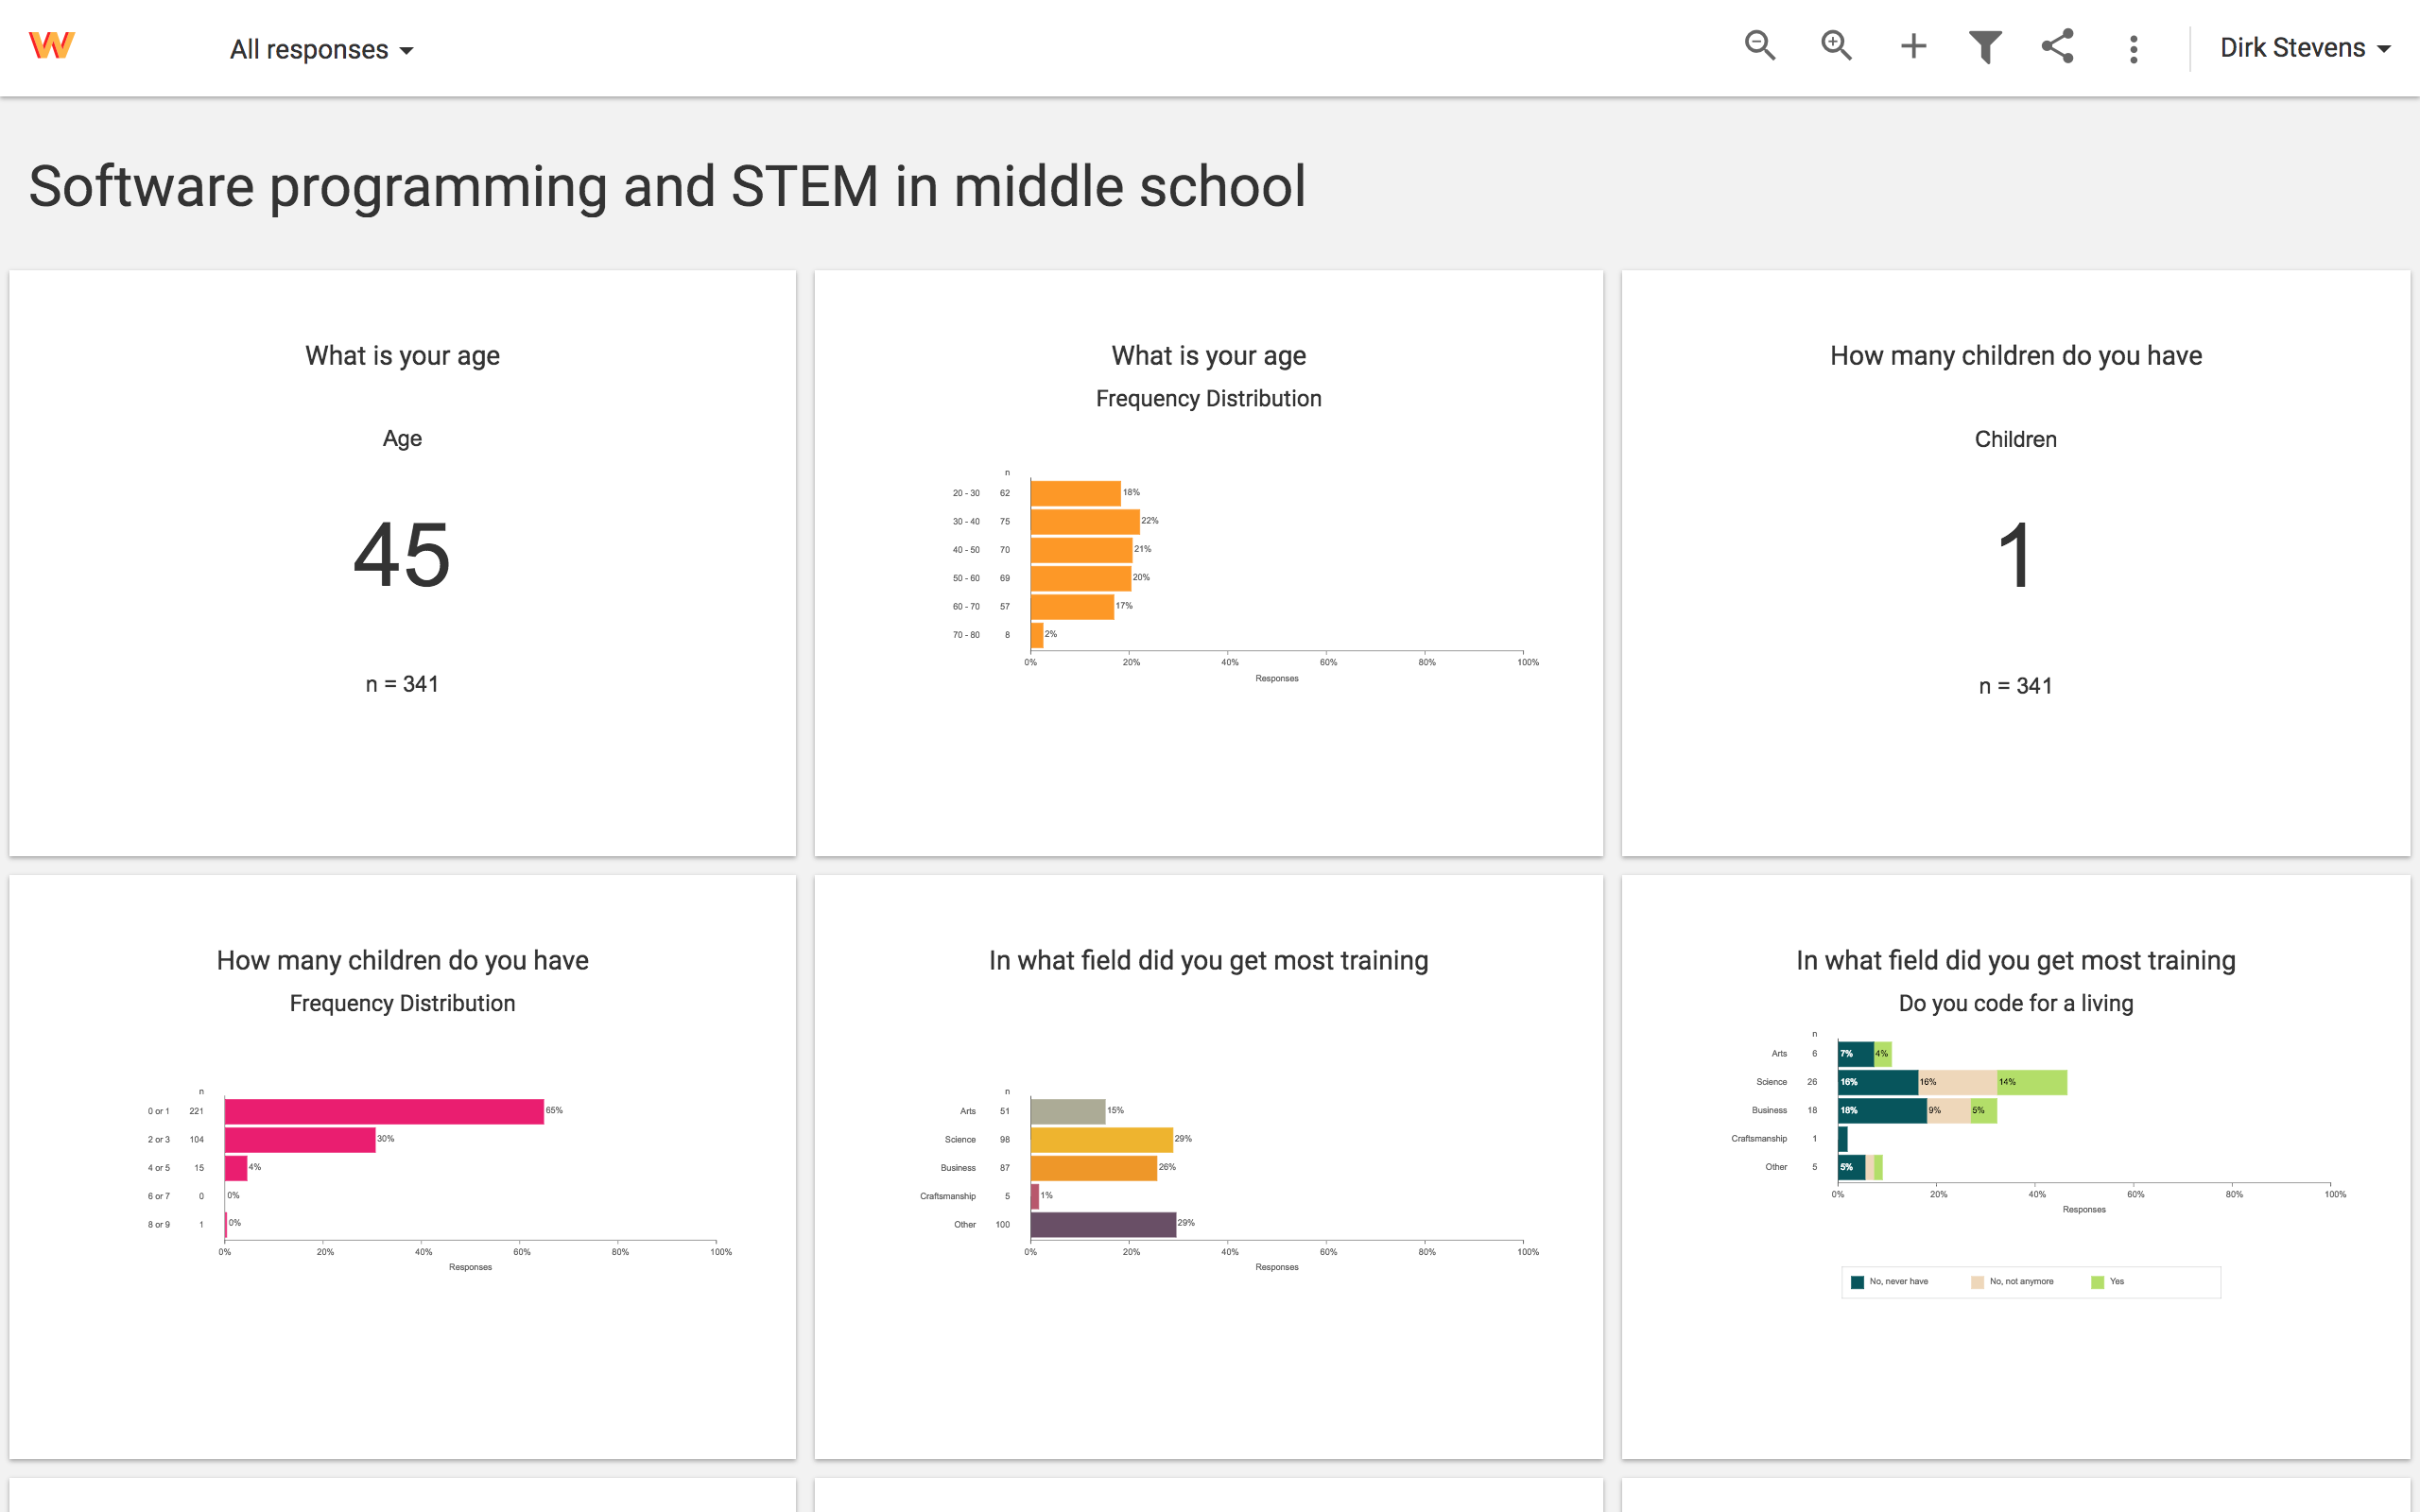
With a single click you get an interactive report based on your survey. With visuals that provide clear insights in the answers that your respondents provided to your questions.
Segment, filter and
Dig Deeper
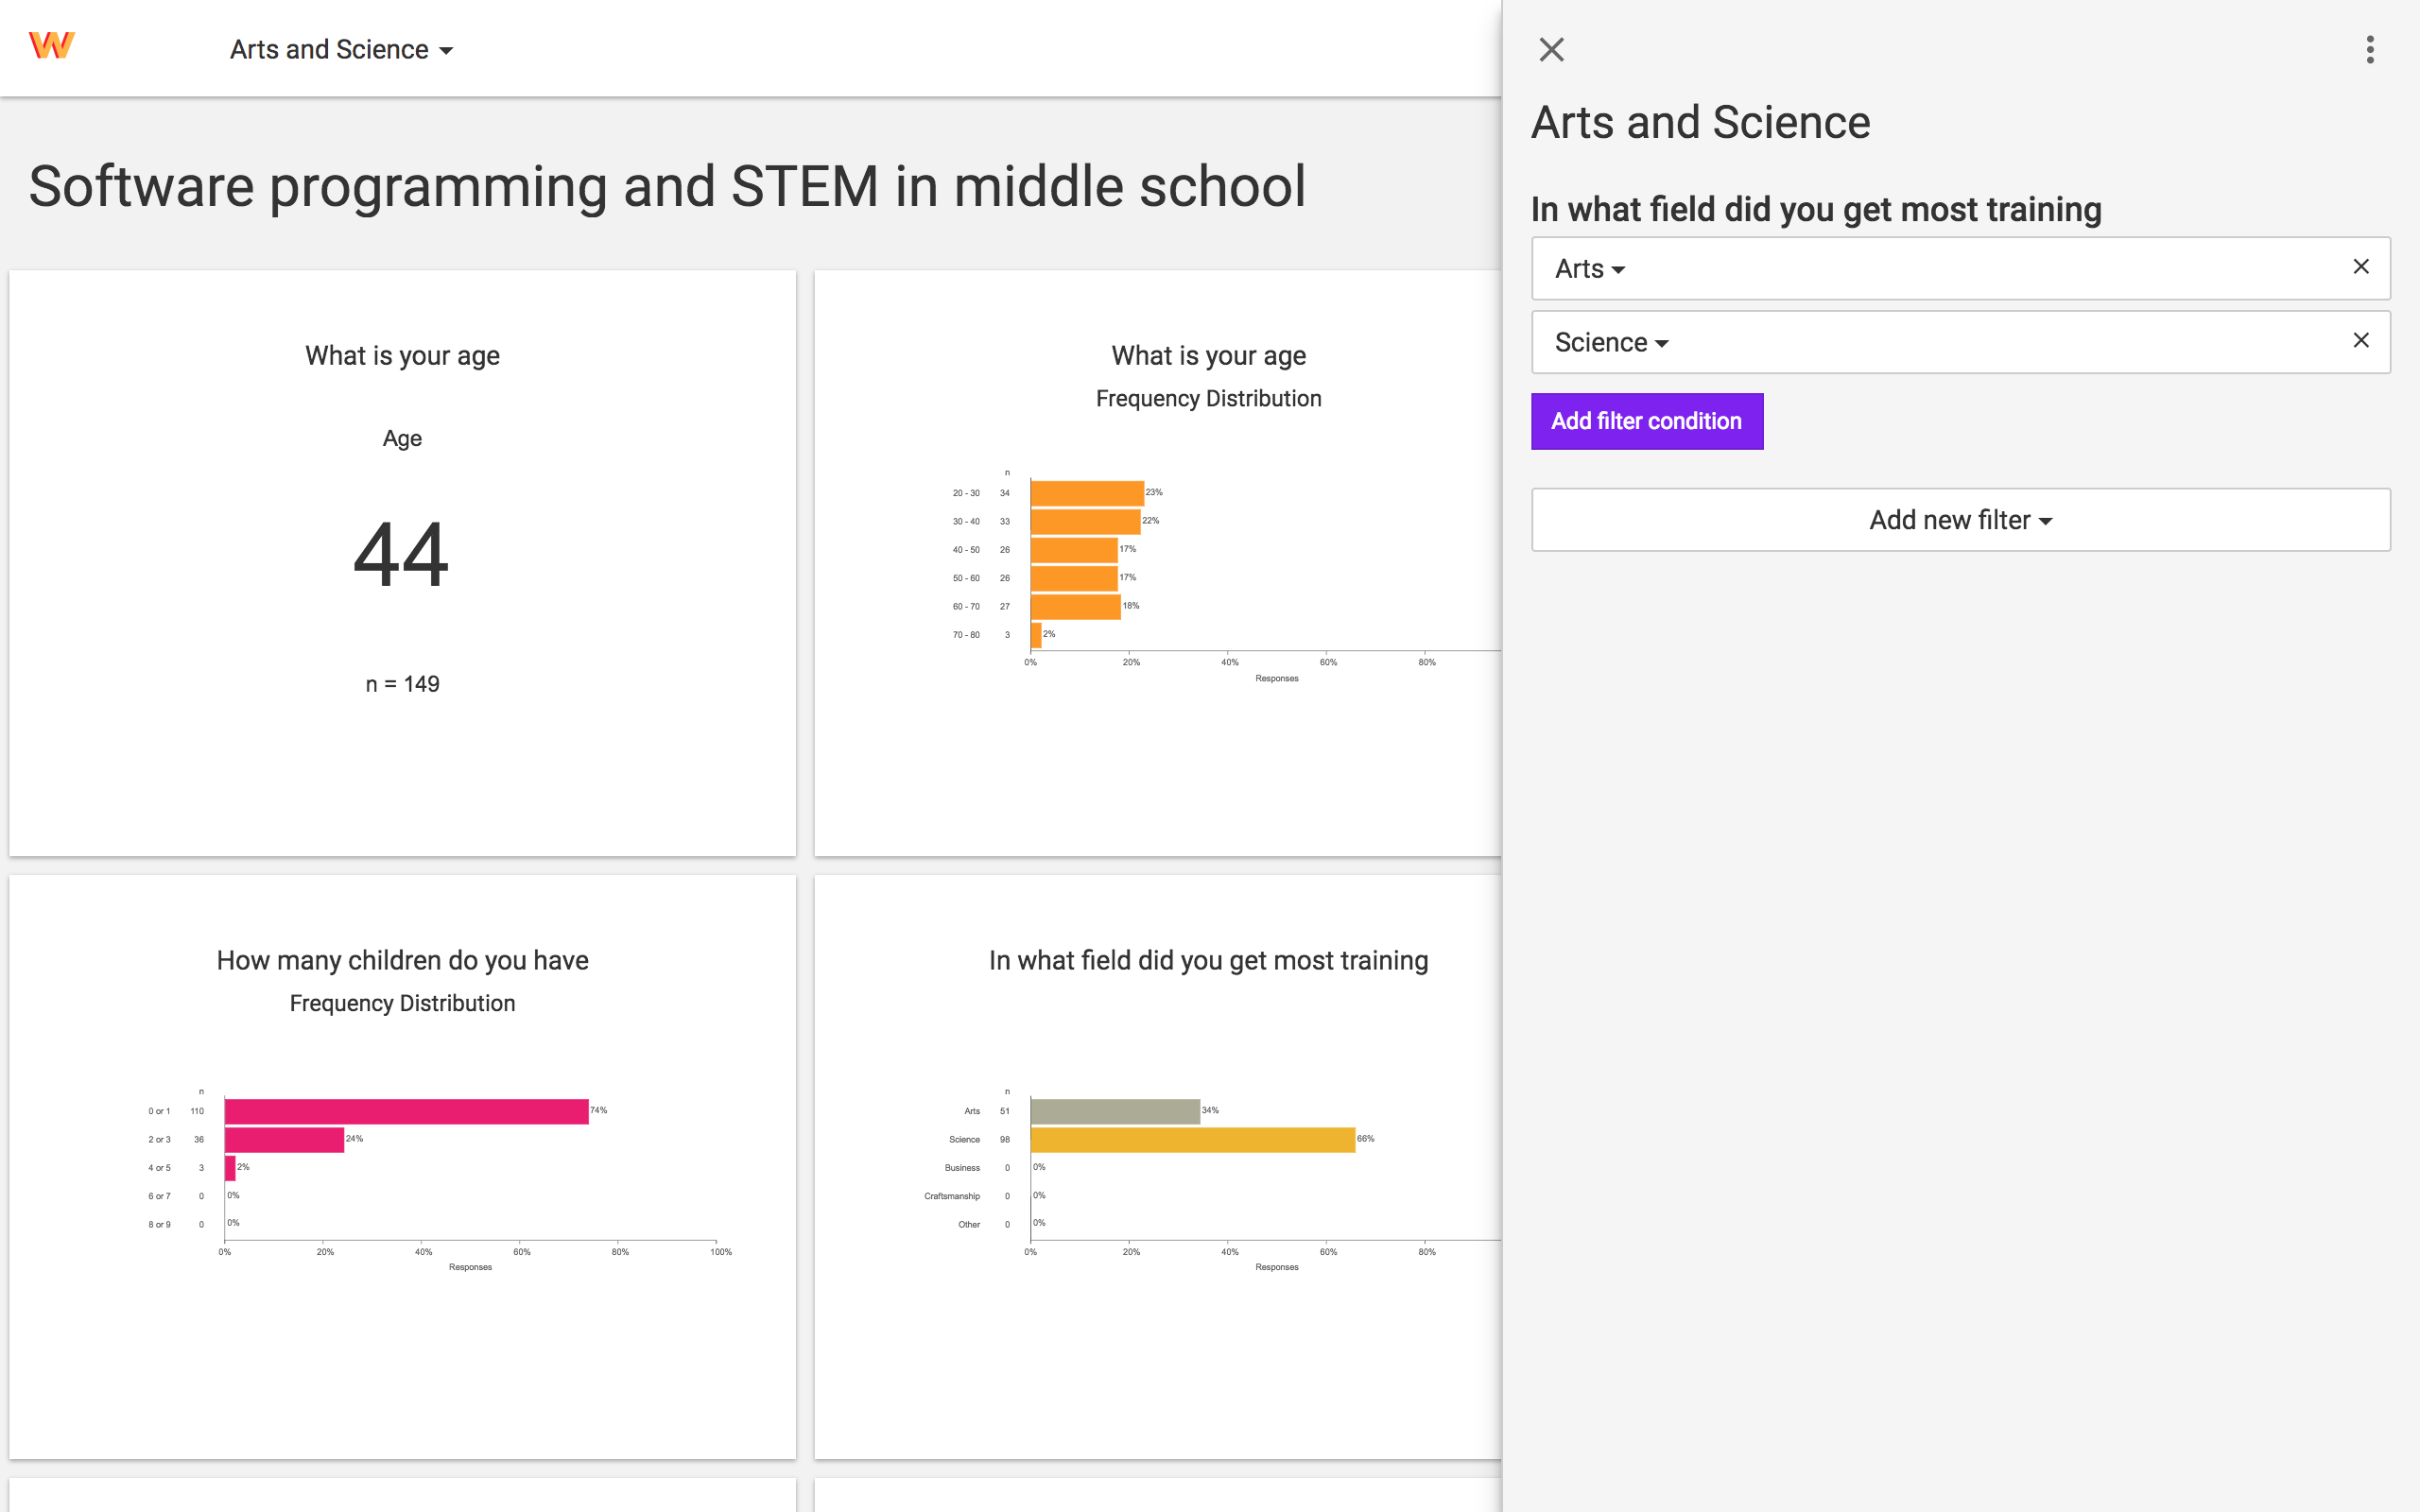
Setup segments with filters and combinations of filters and immediately see differences in groups of responses.
Merge visuals with
Visual Crosstabs
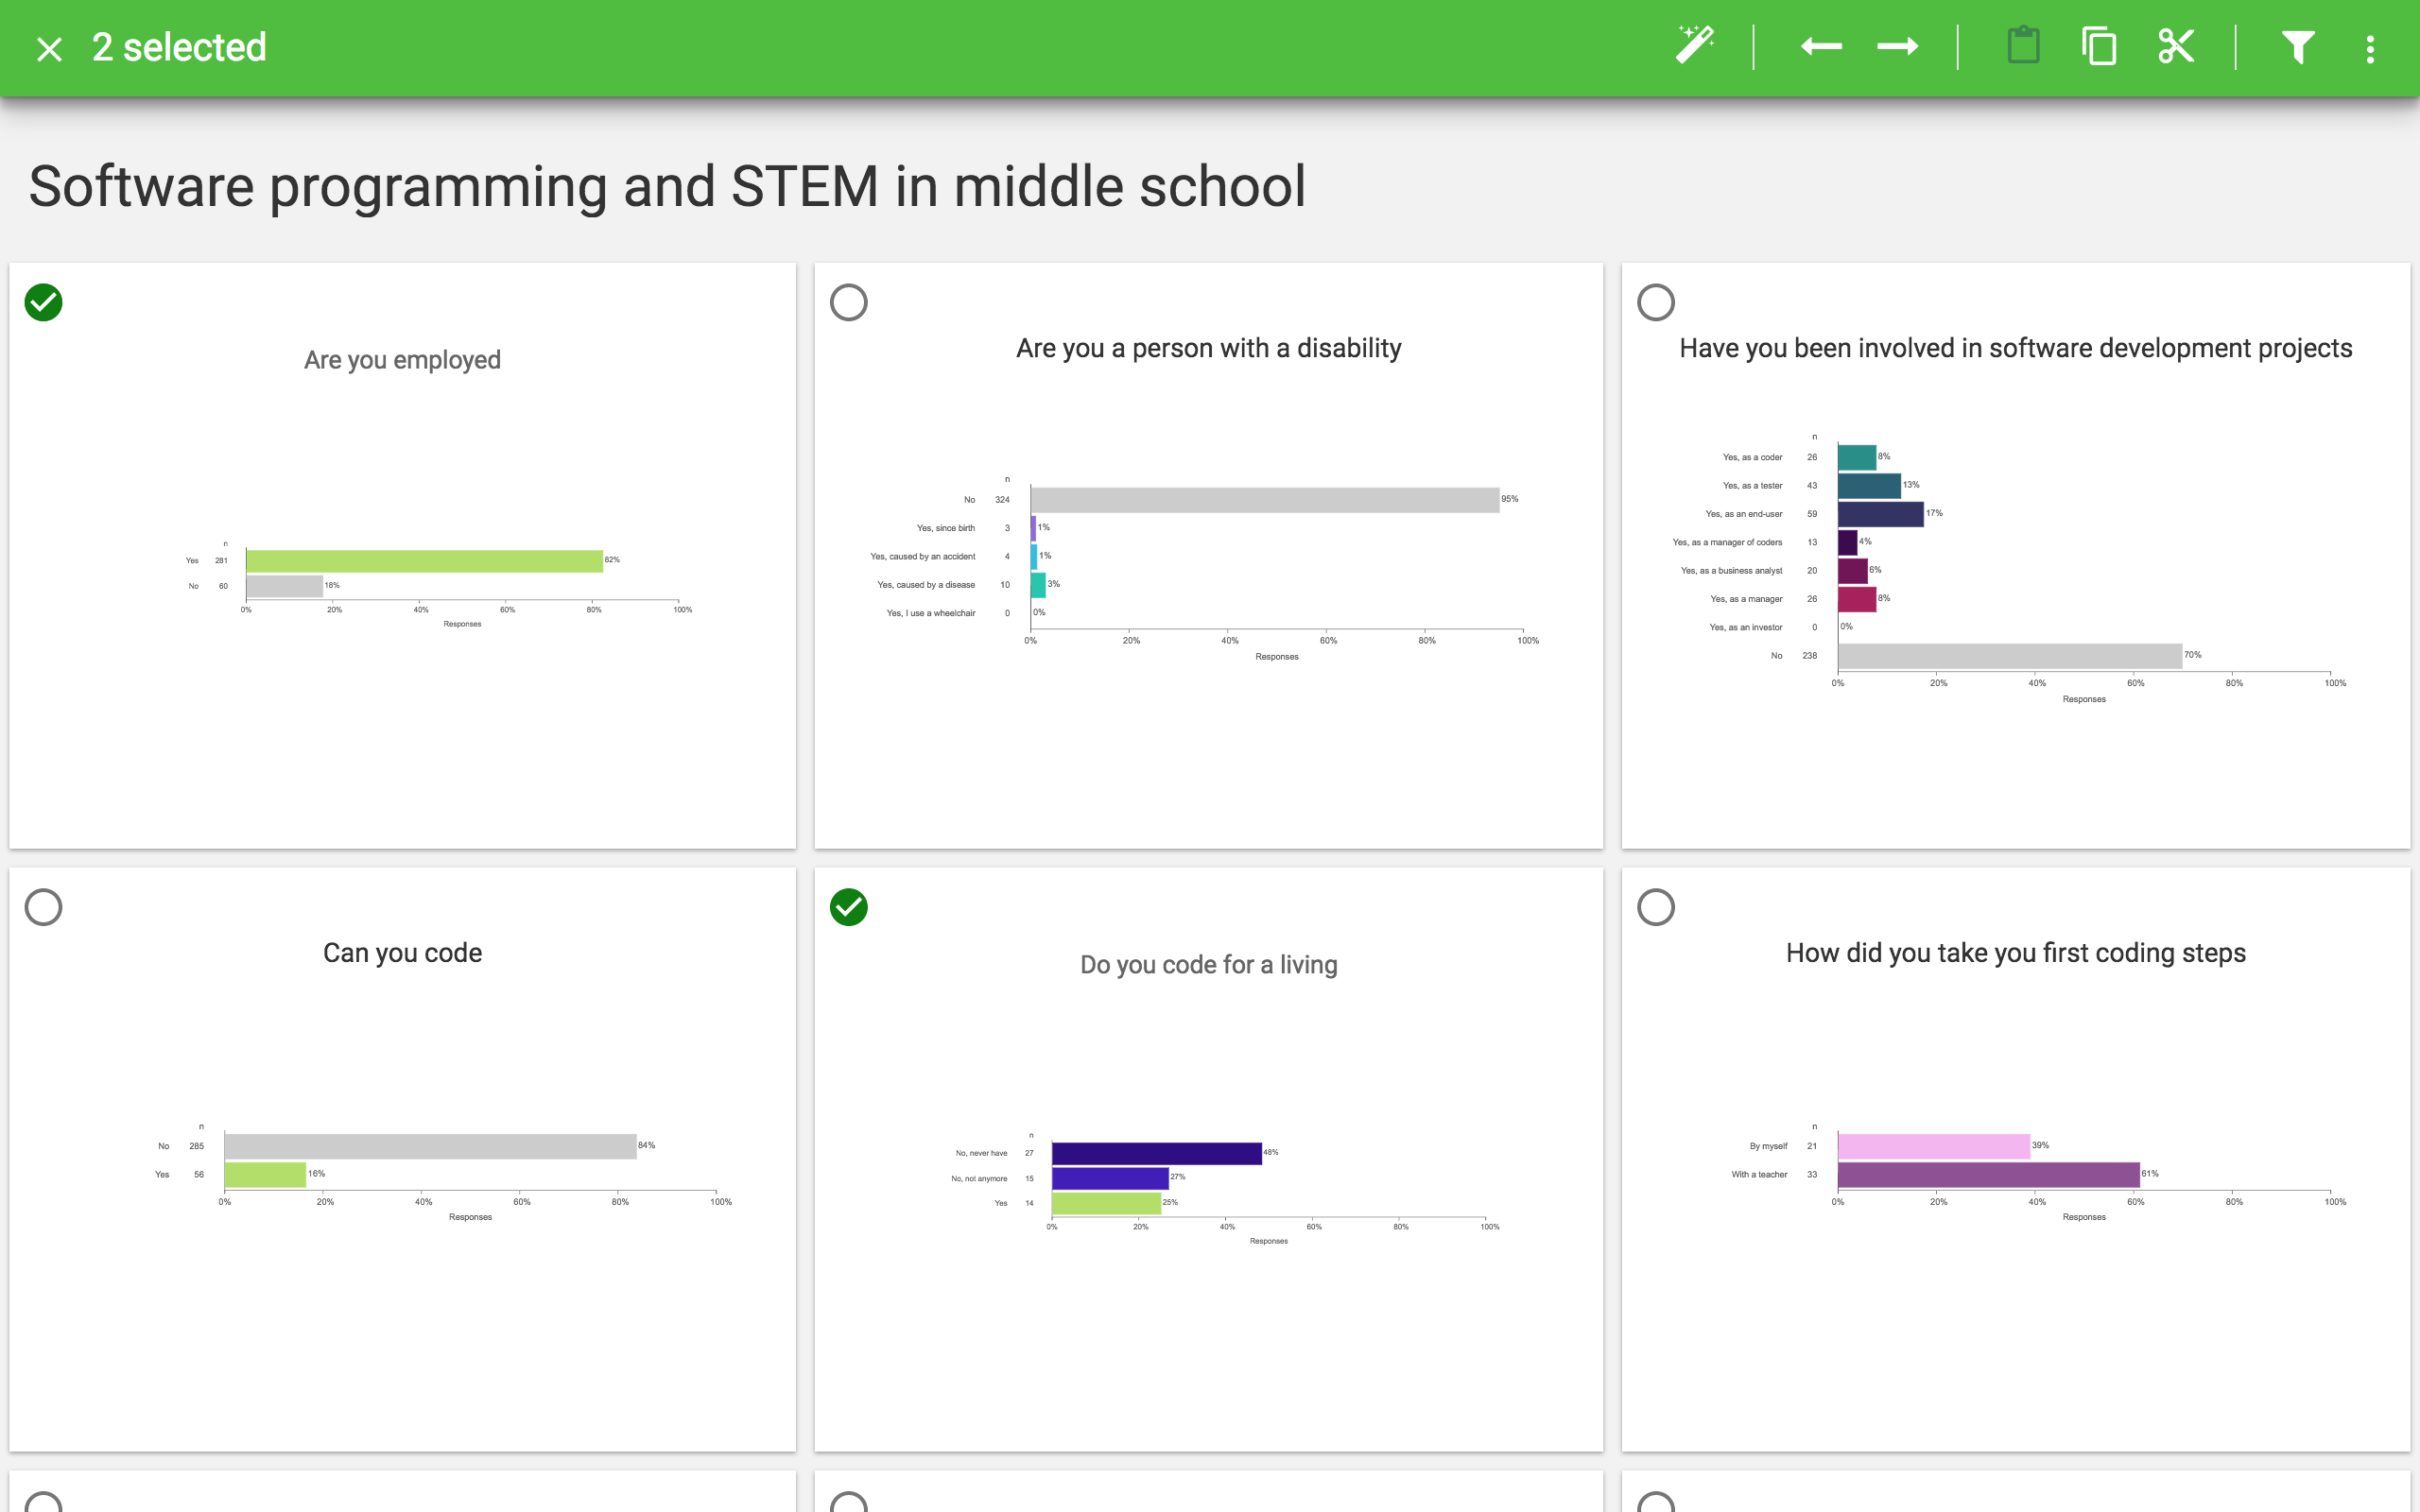
Select 2 visuals, click "Merge" and get an entirely new perspective.
Make your visuals
Look Exactly Right
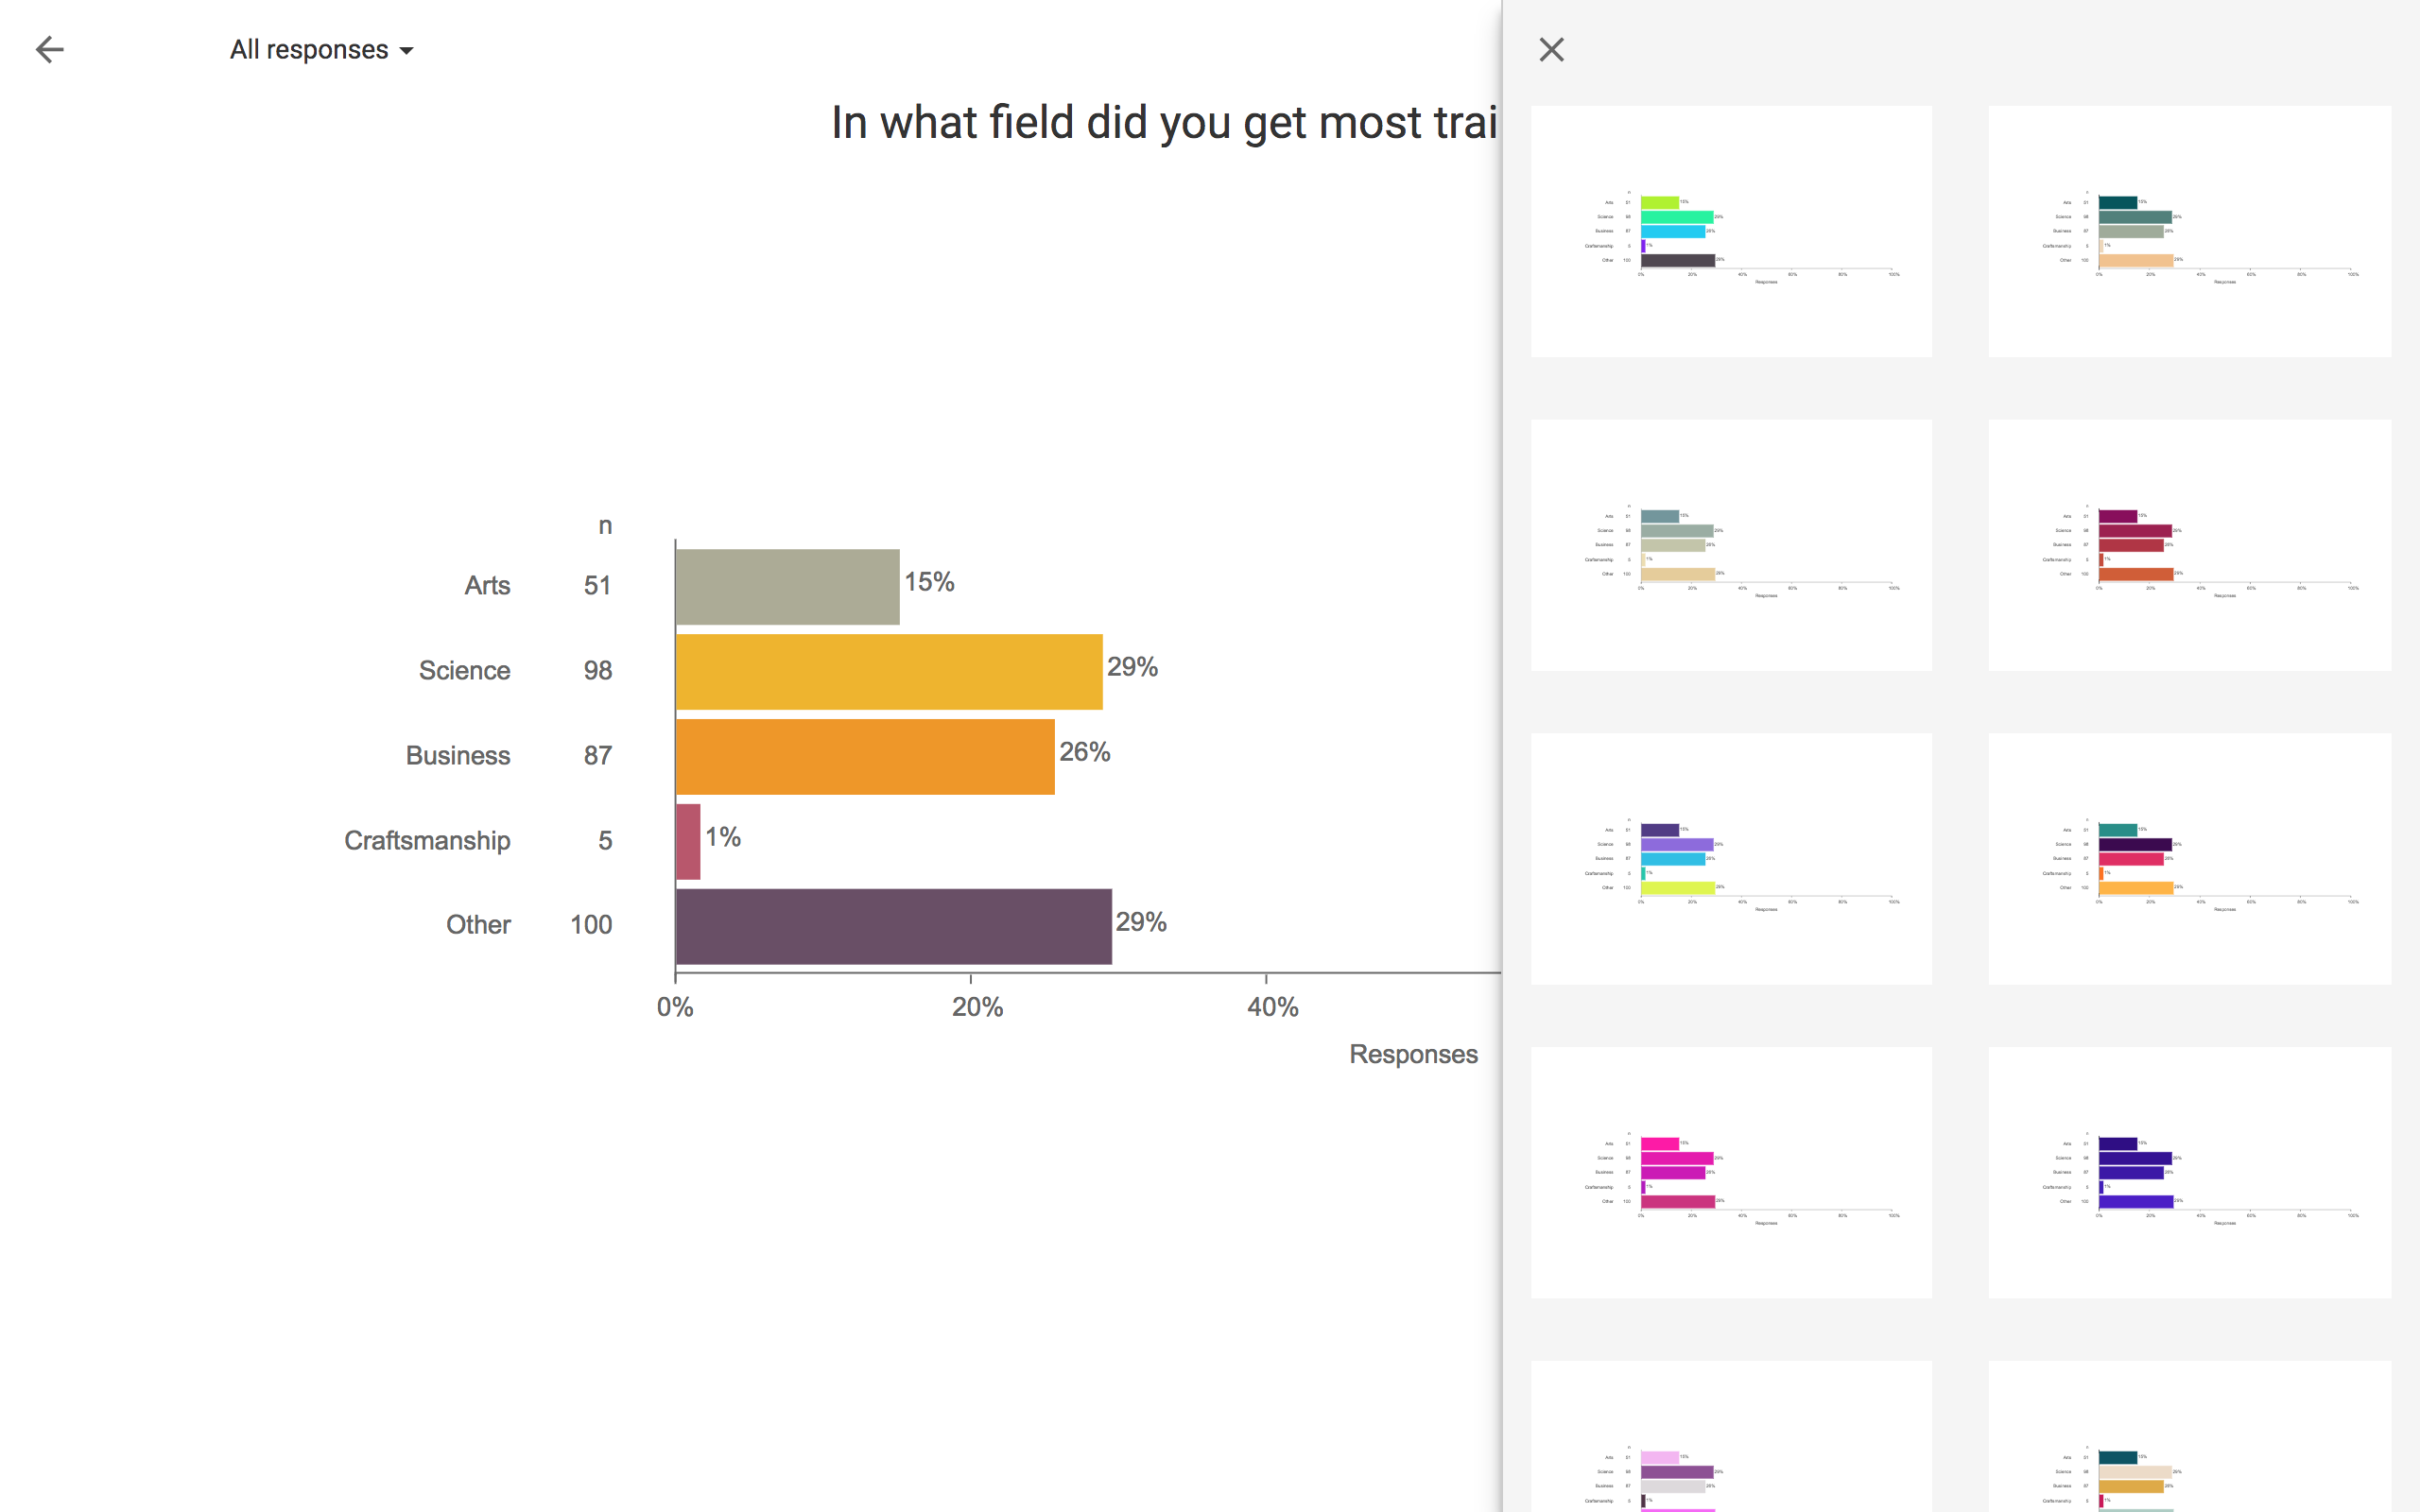
Modify colors, labels and types of charts with a few simple clicks.
To inspire you, we provide beautiful palettes of colors that work well together.
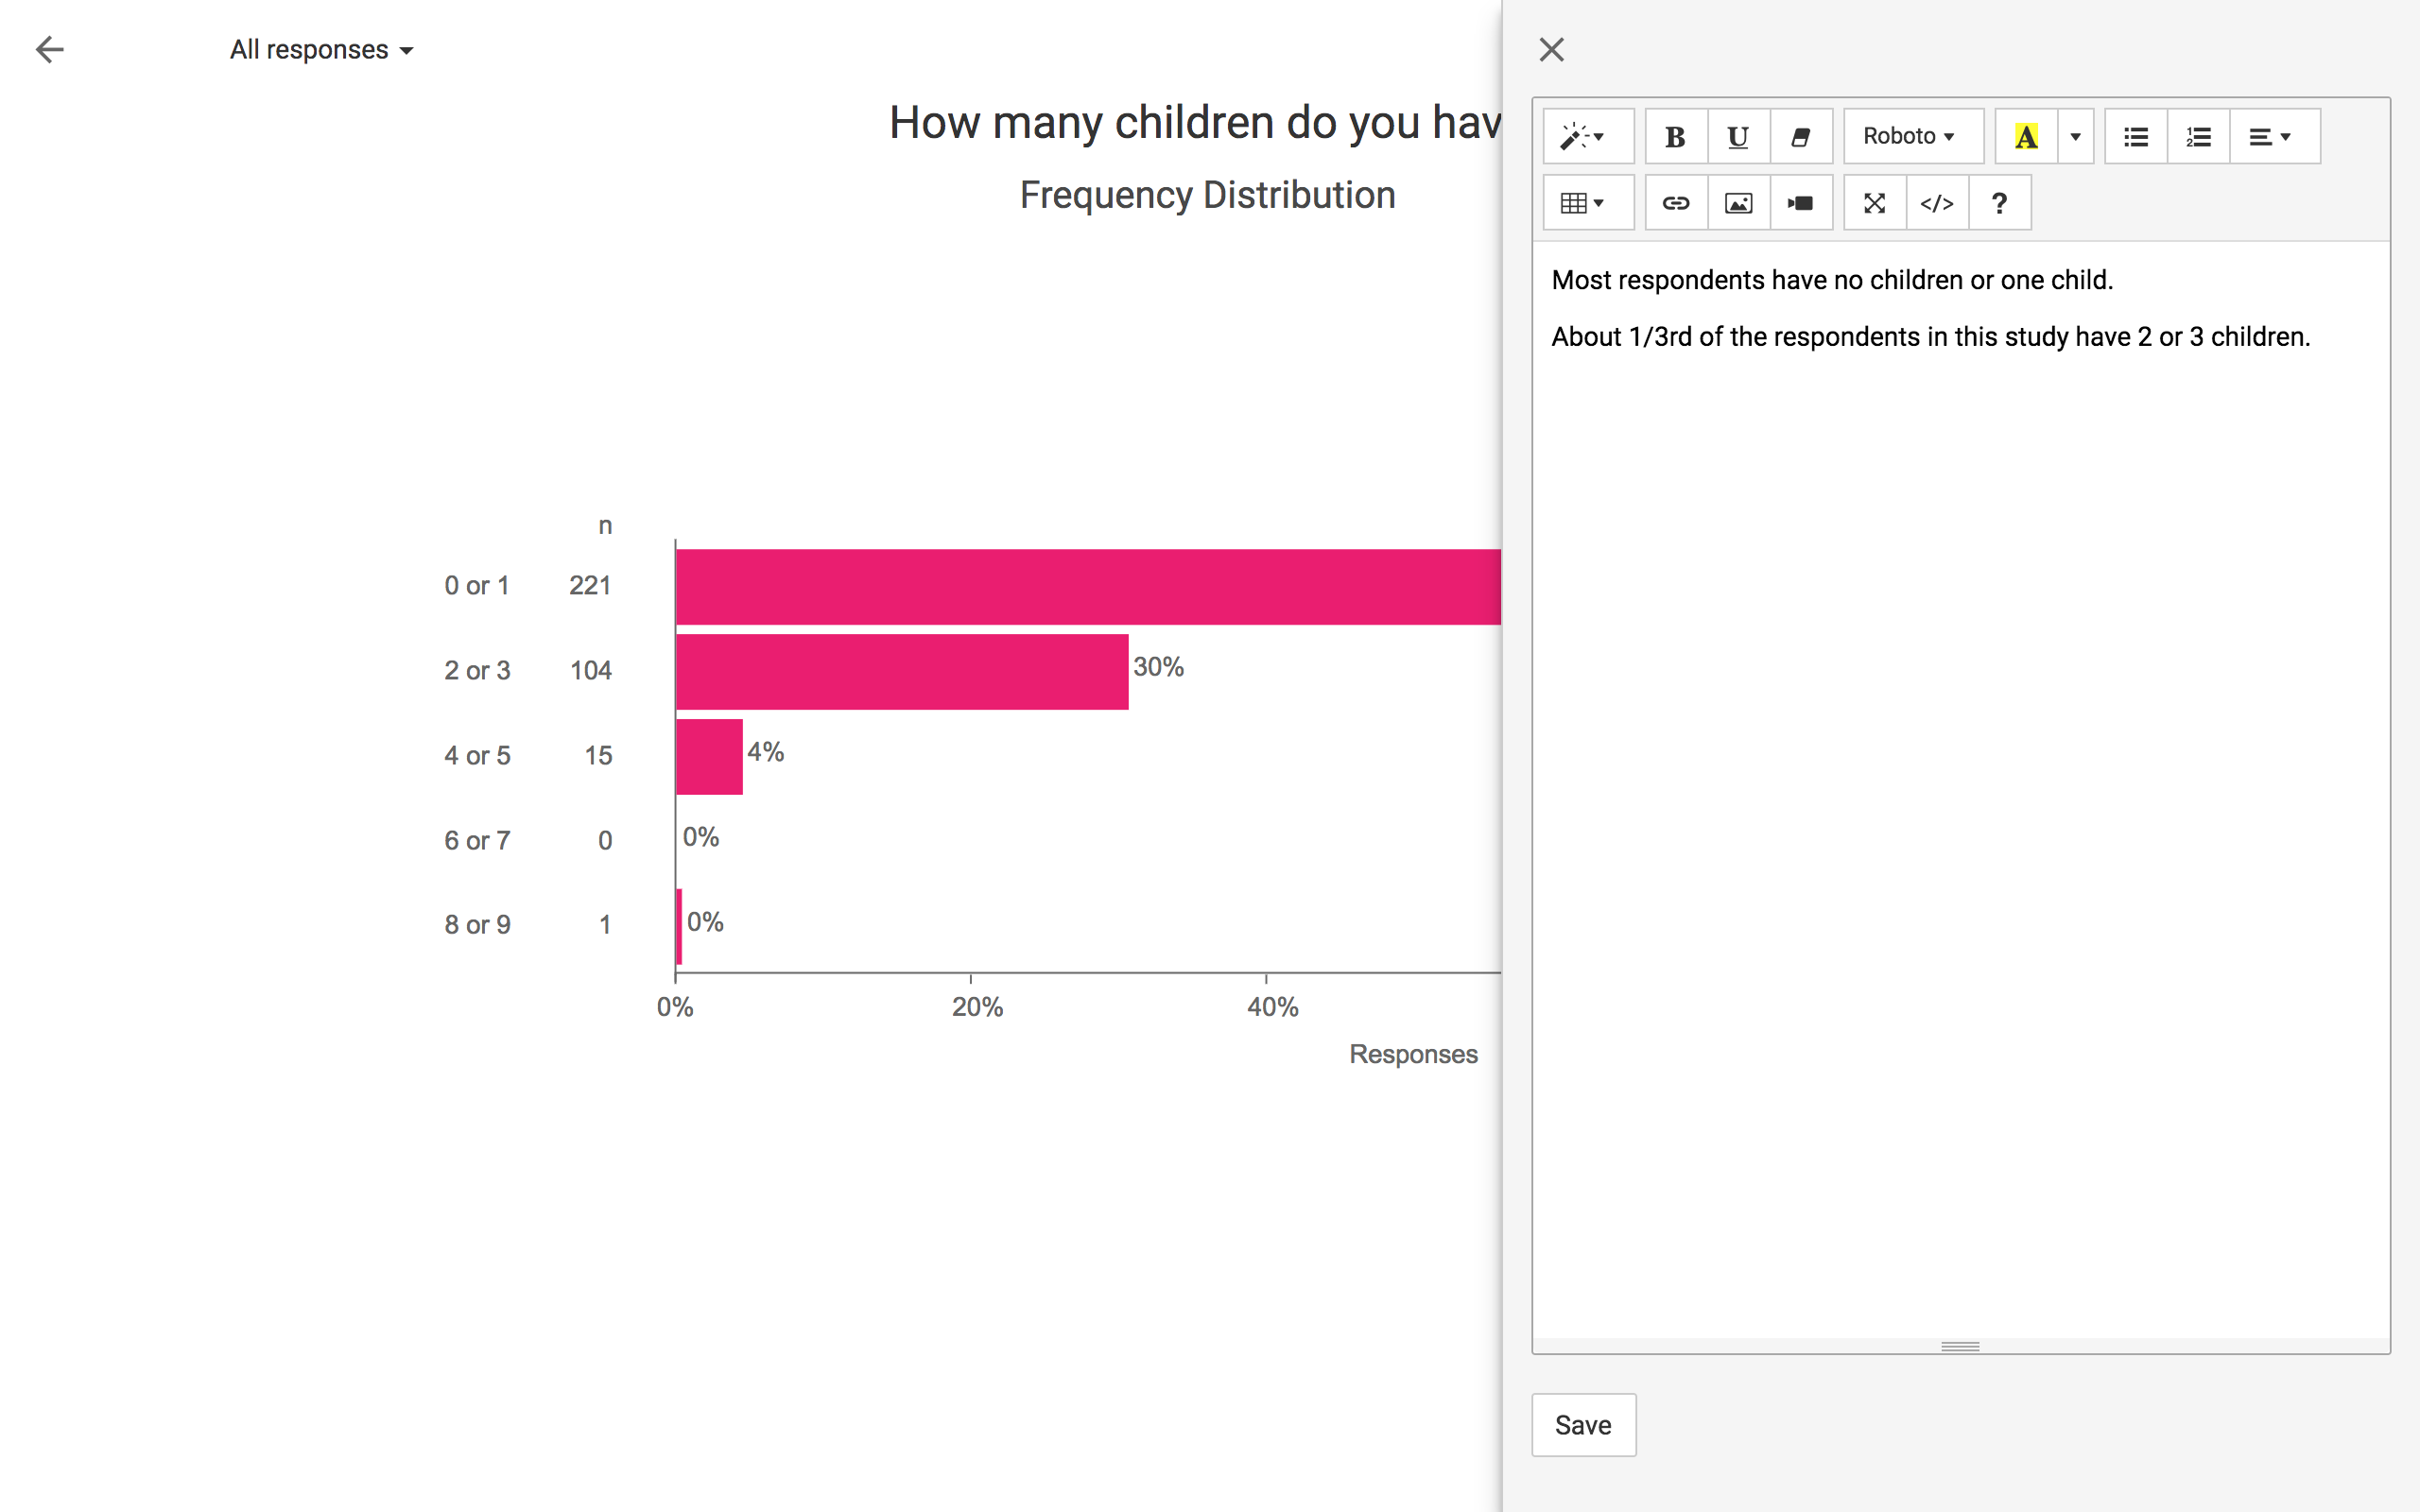
Highlight your insights and
Add Notes
Writing notes with your visuals is as simple as writing them in your favorite text editor.
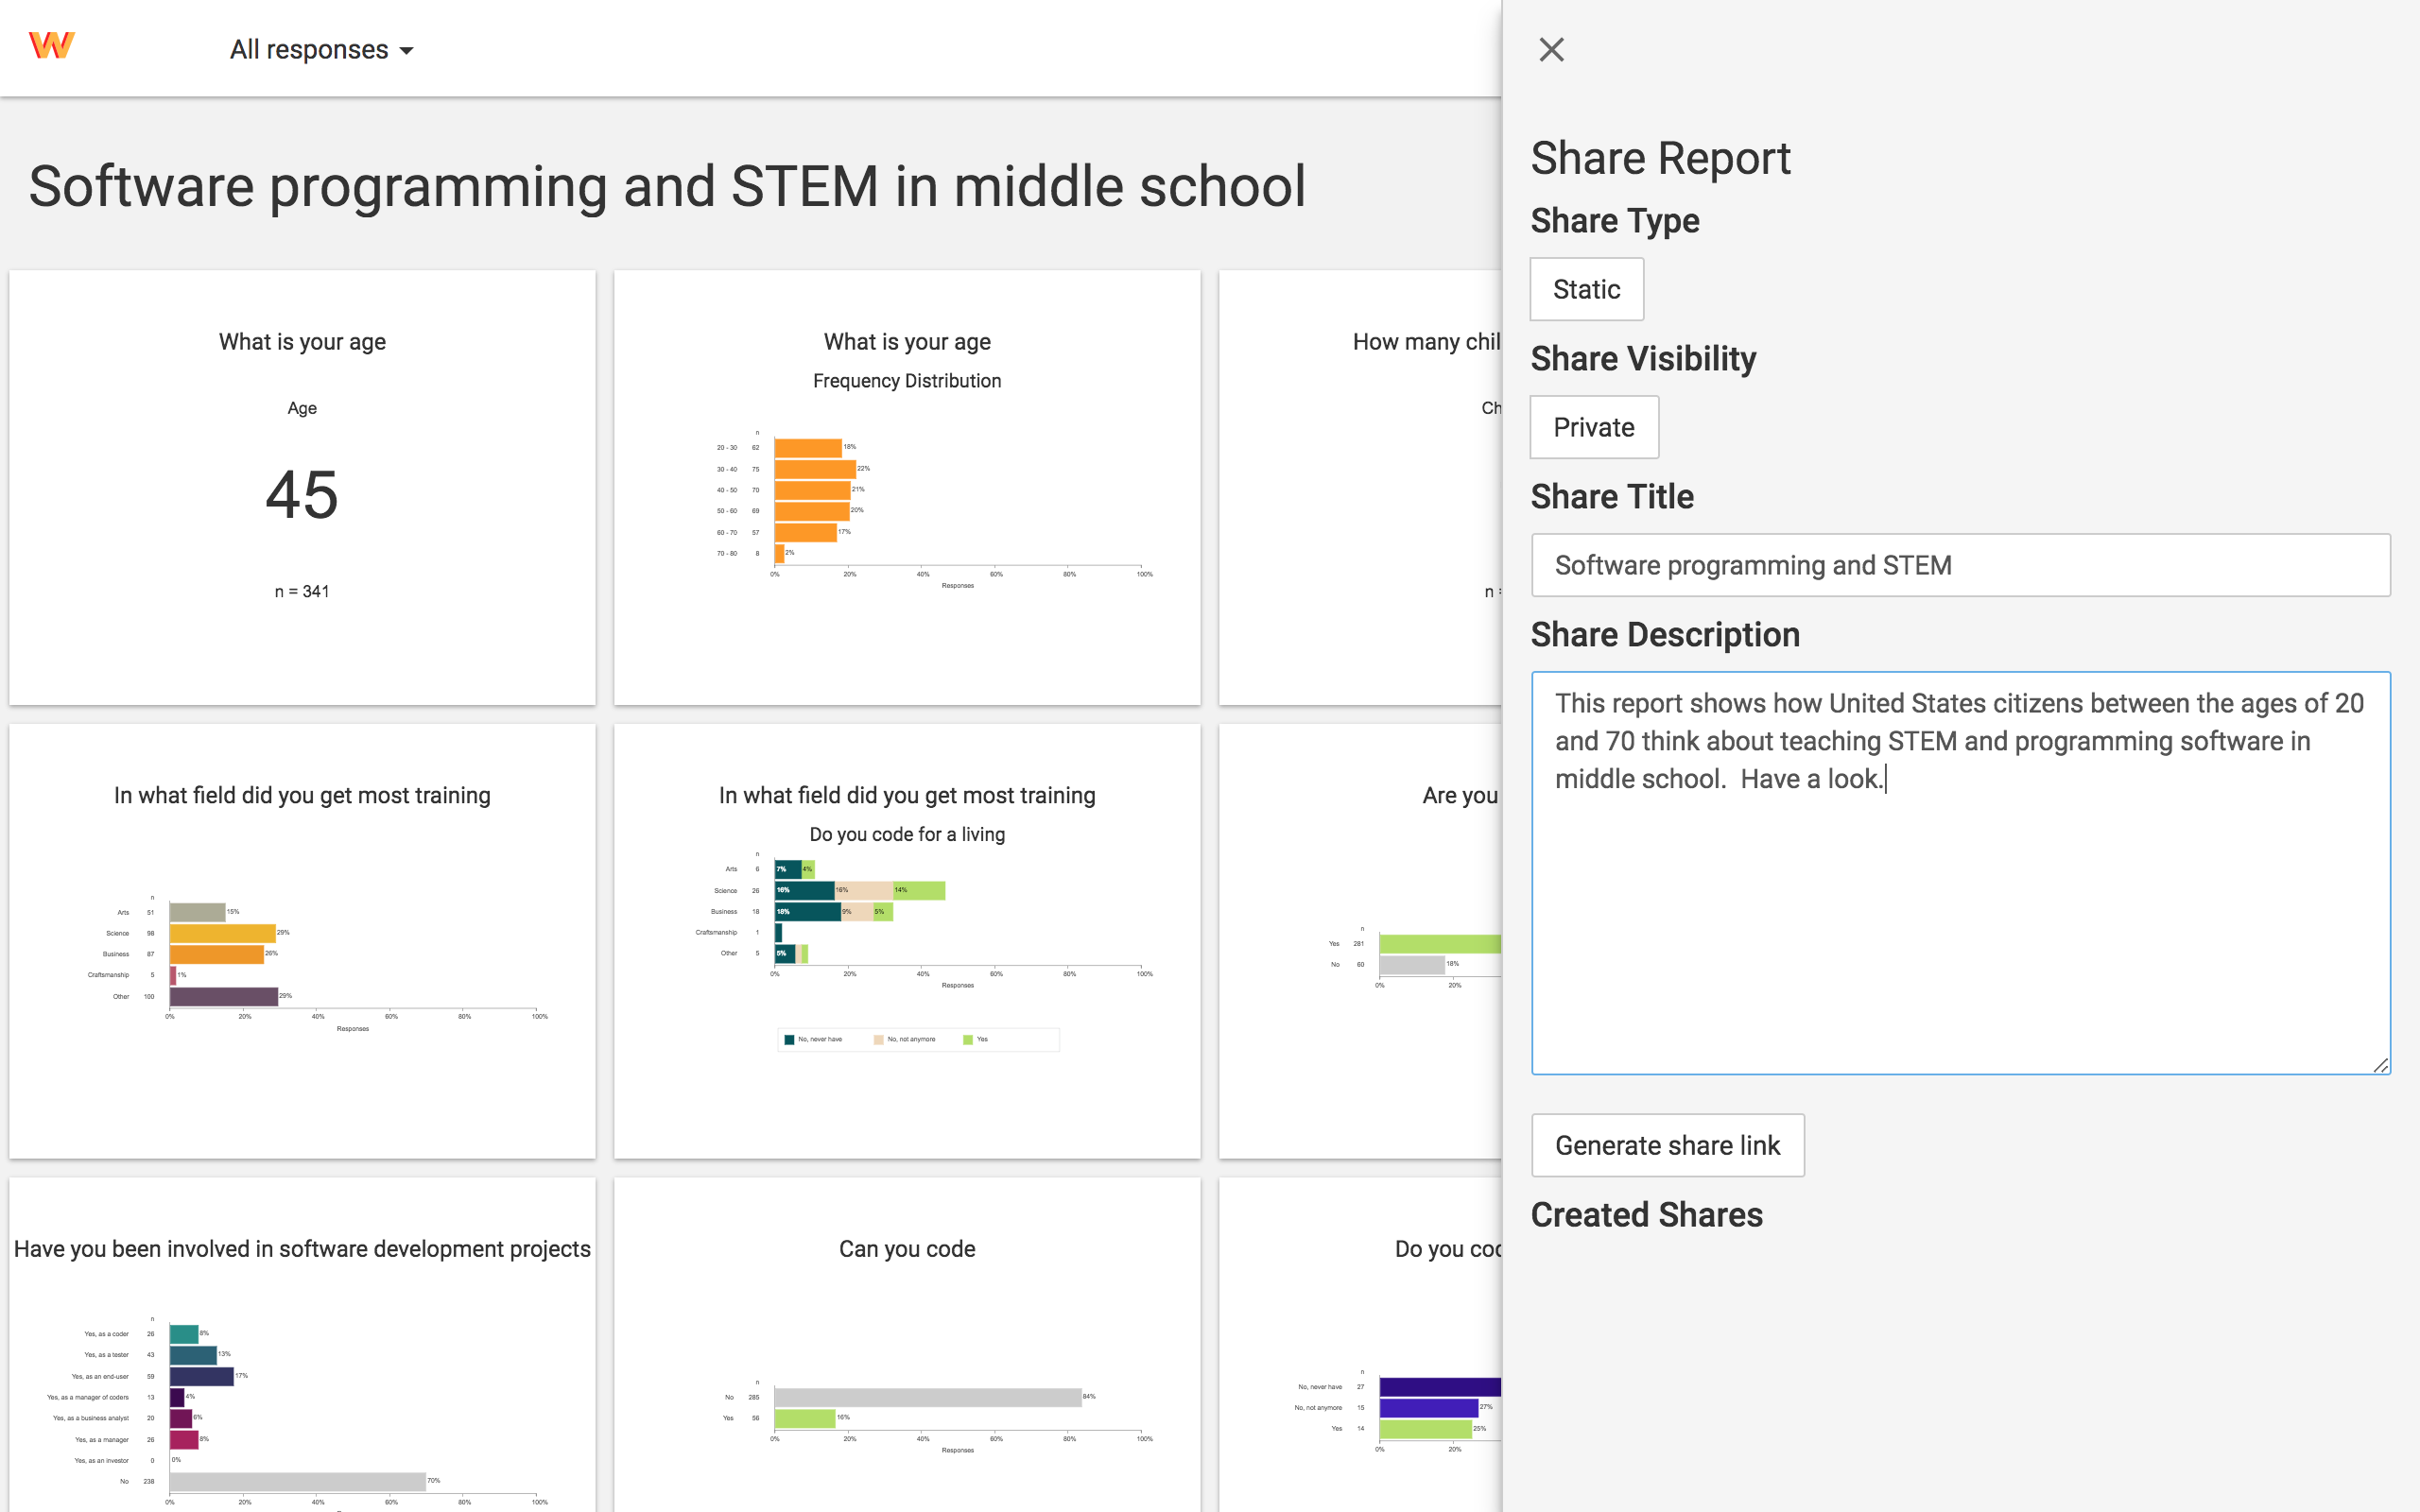
Inform your audience and
Share Your Report
Share your report with a colleague or customer.
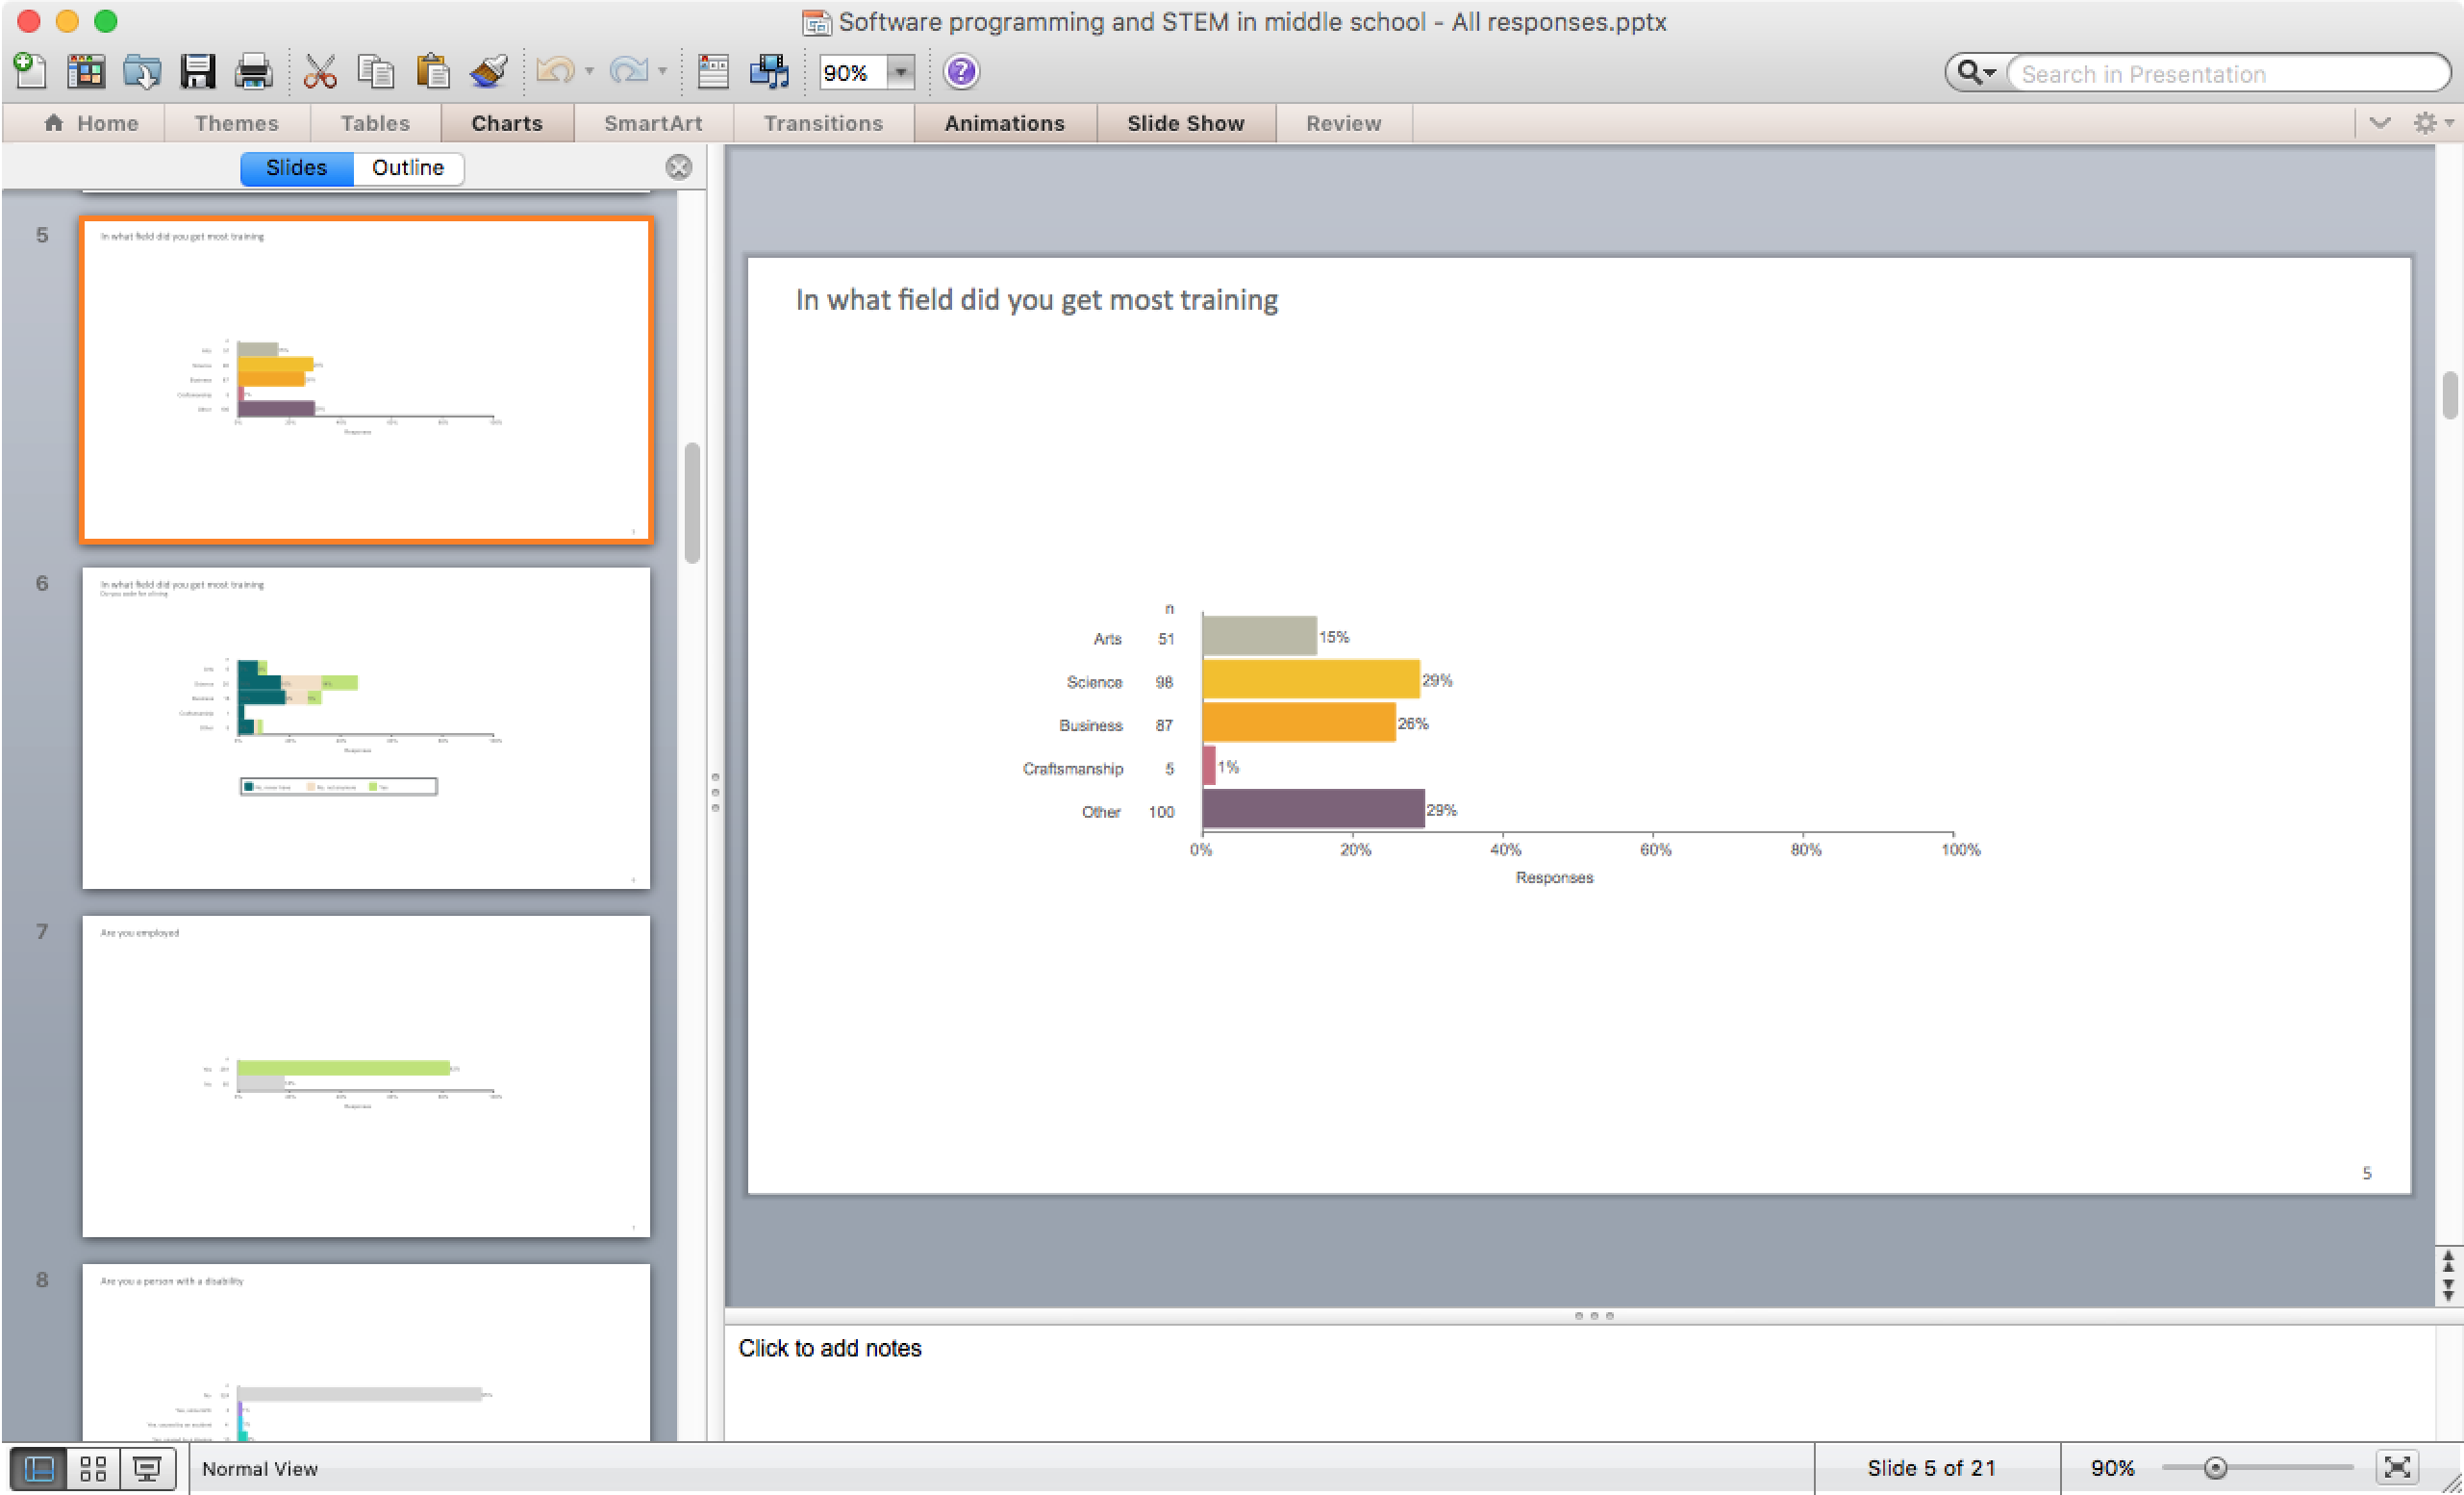
For that important presentation
Export to PowerPoint
Our PowerPoint export is special. We export visuals as vector images so they look great on any screen and on print.
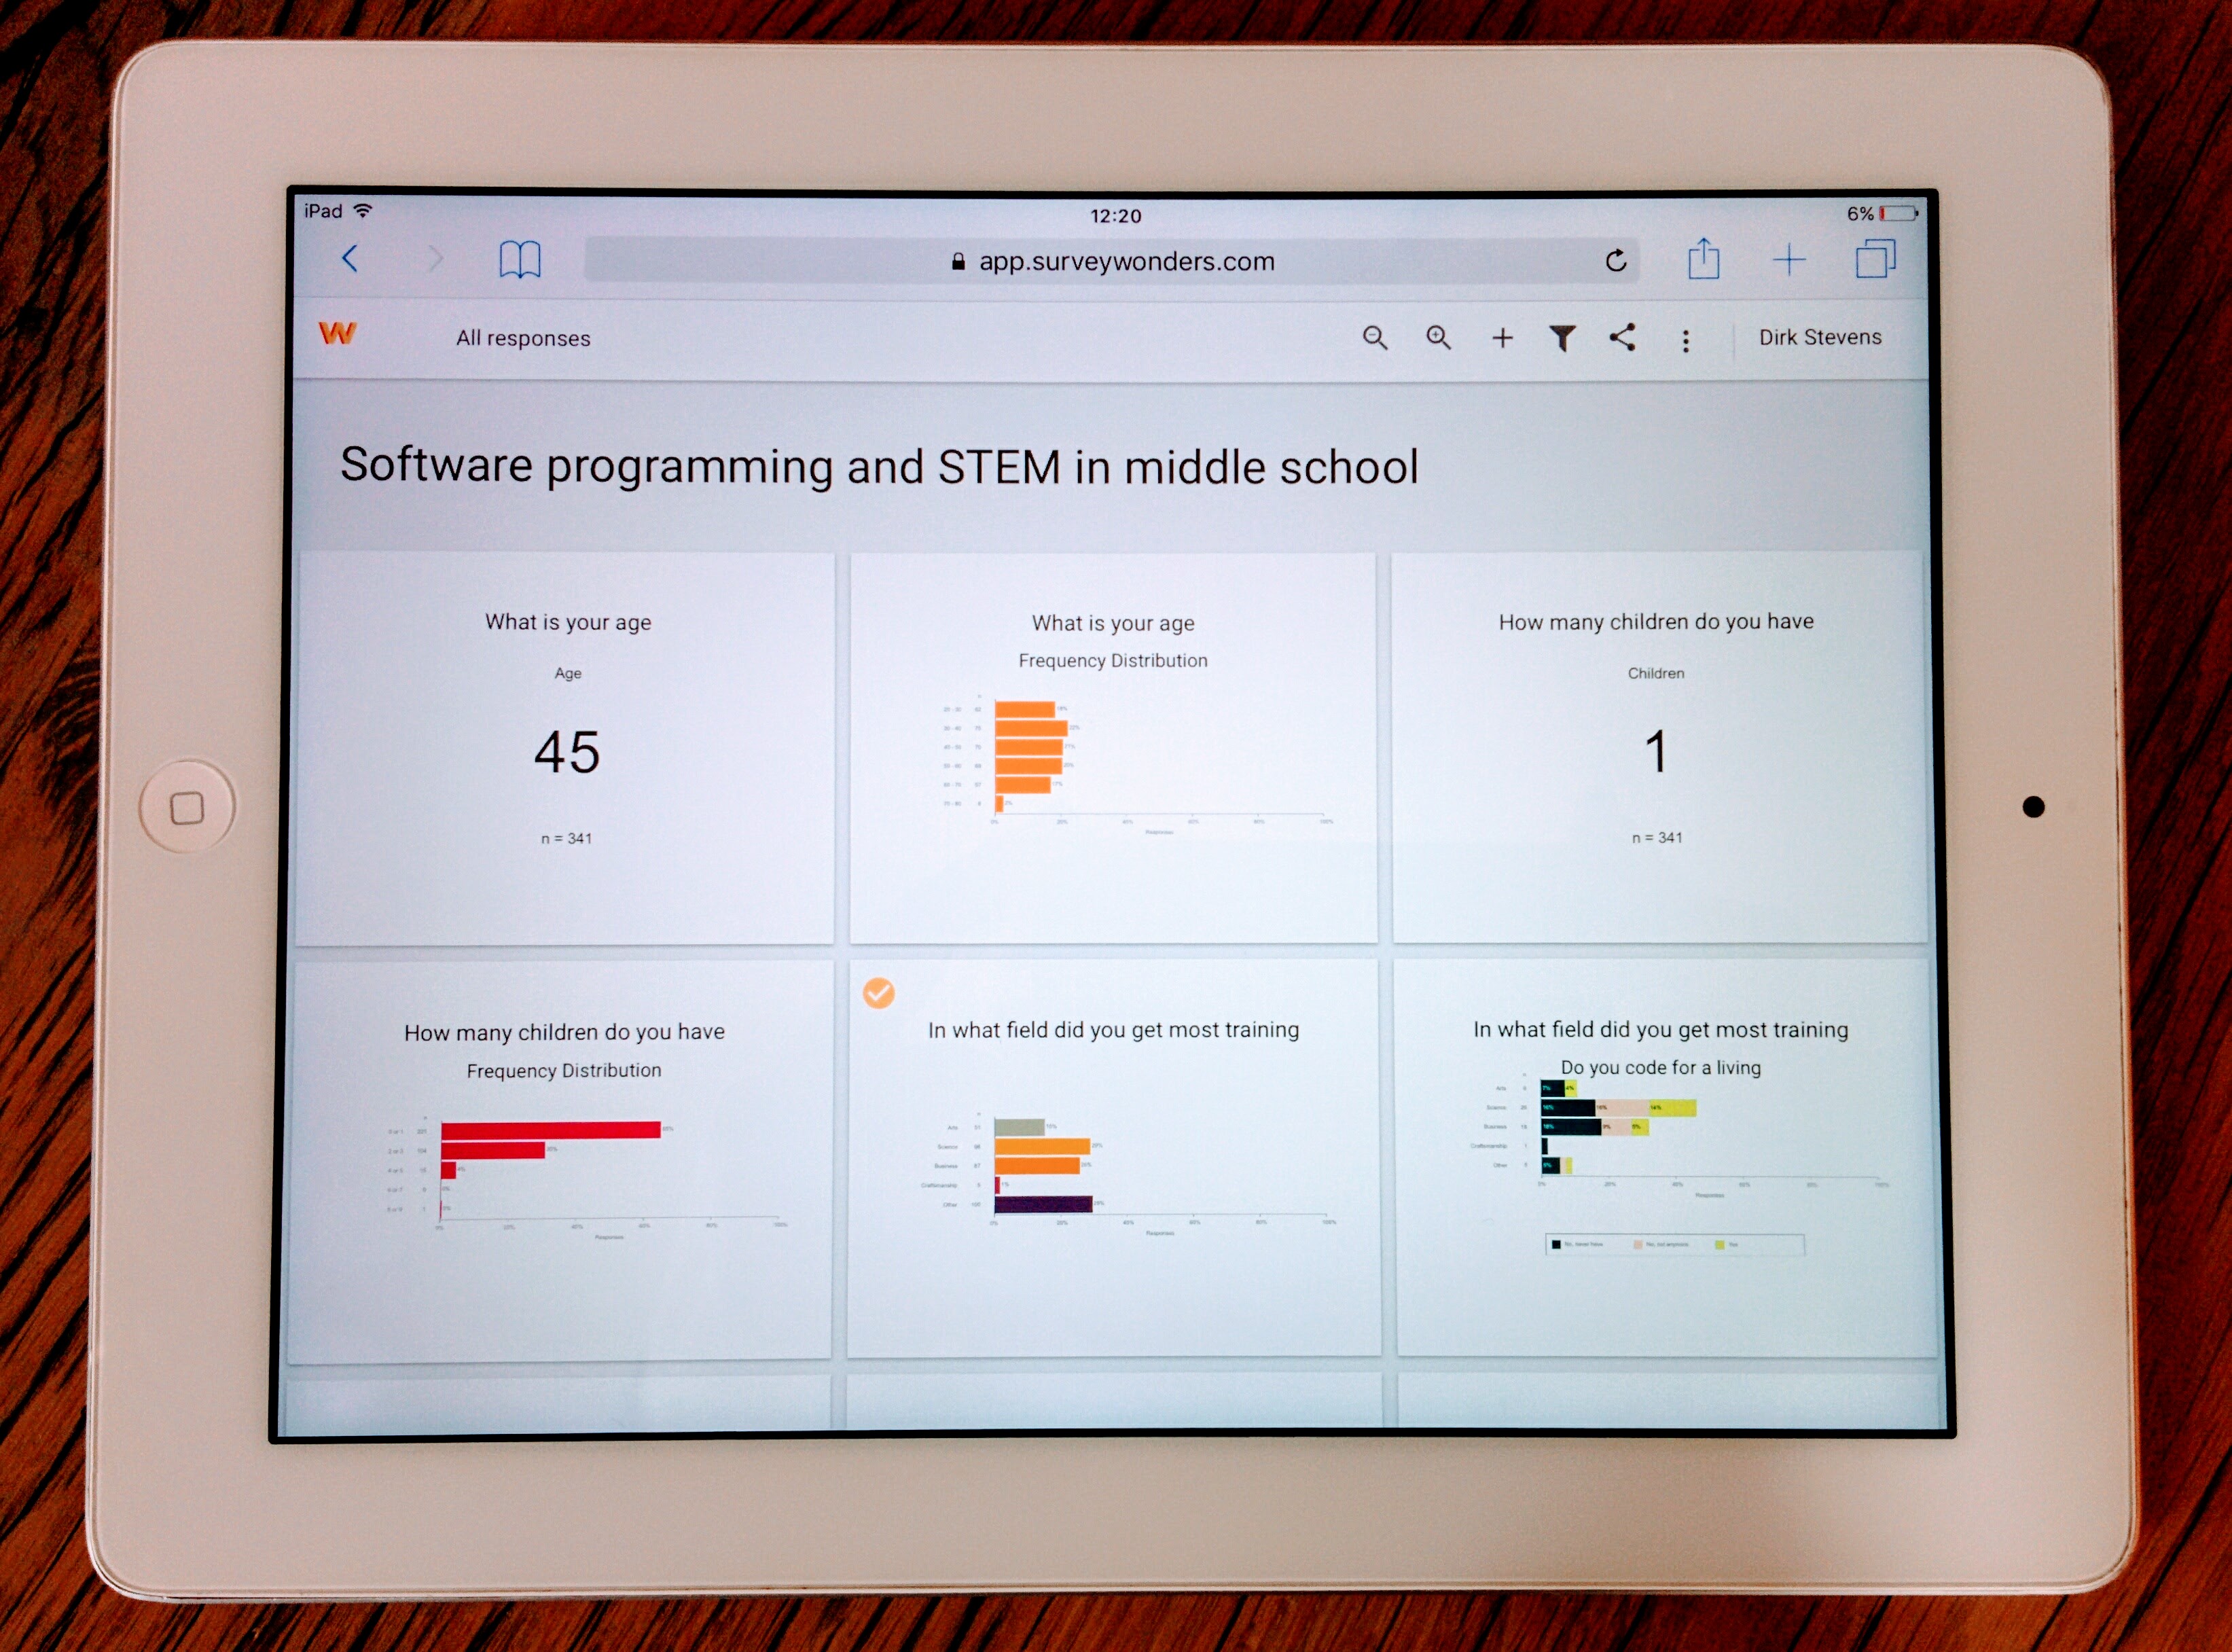
At your desk or on the go
Made For Web and Mobile
Surveywonders works great in your desktop browser and on your tablet.
Designed for impact
Make your research stand out
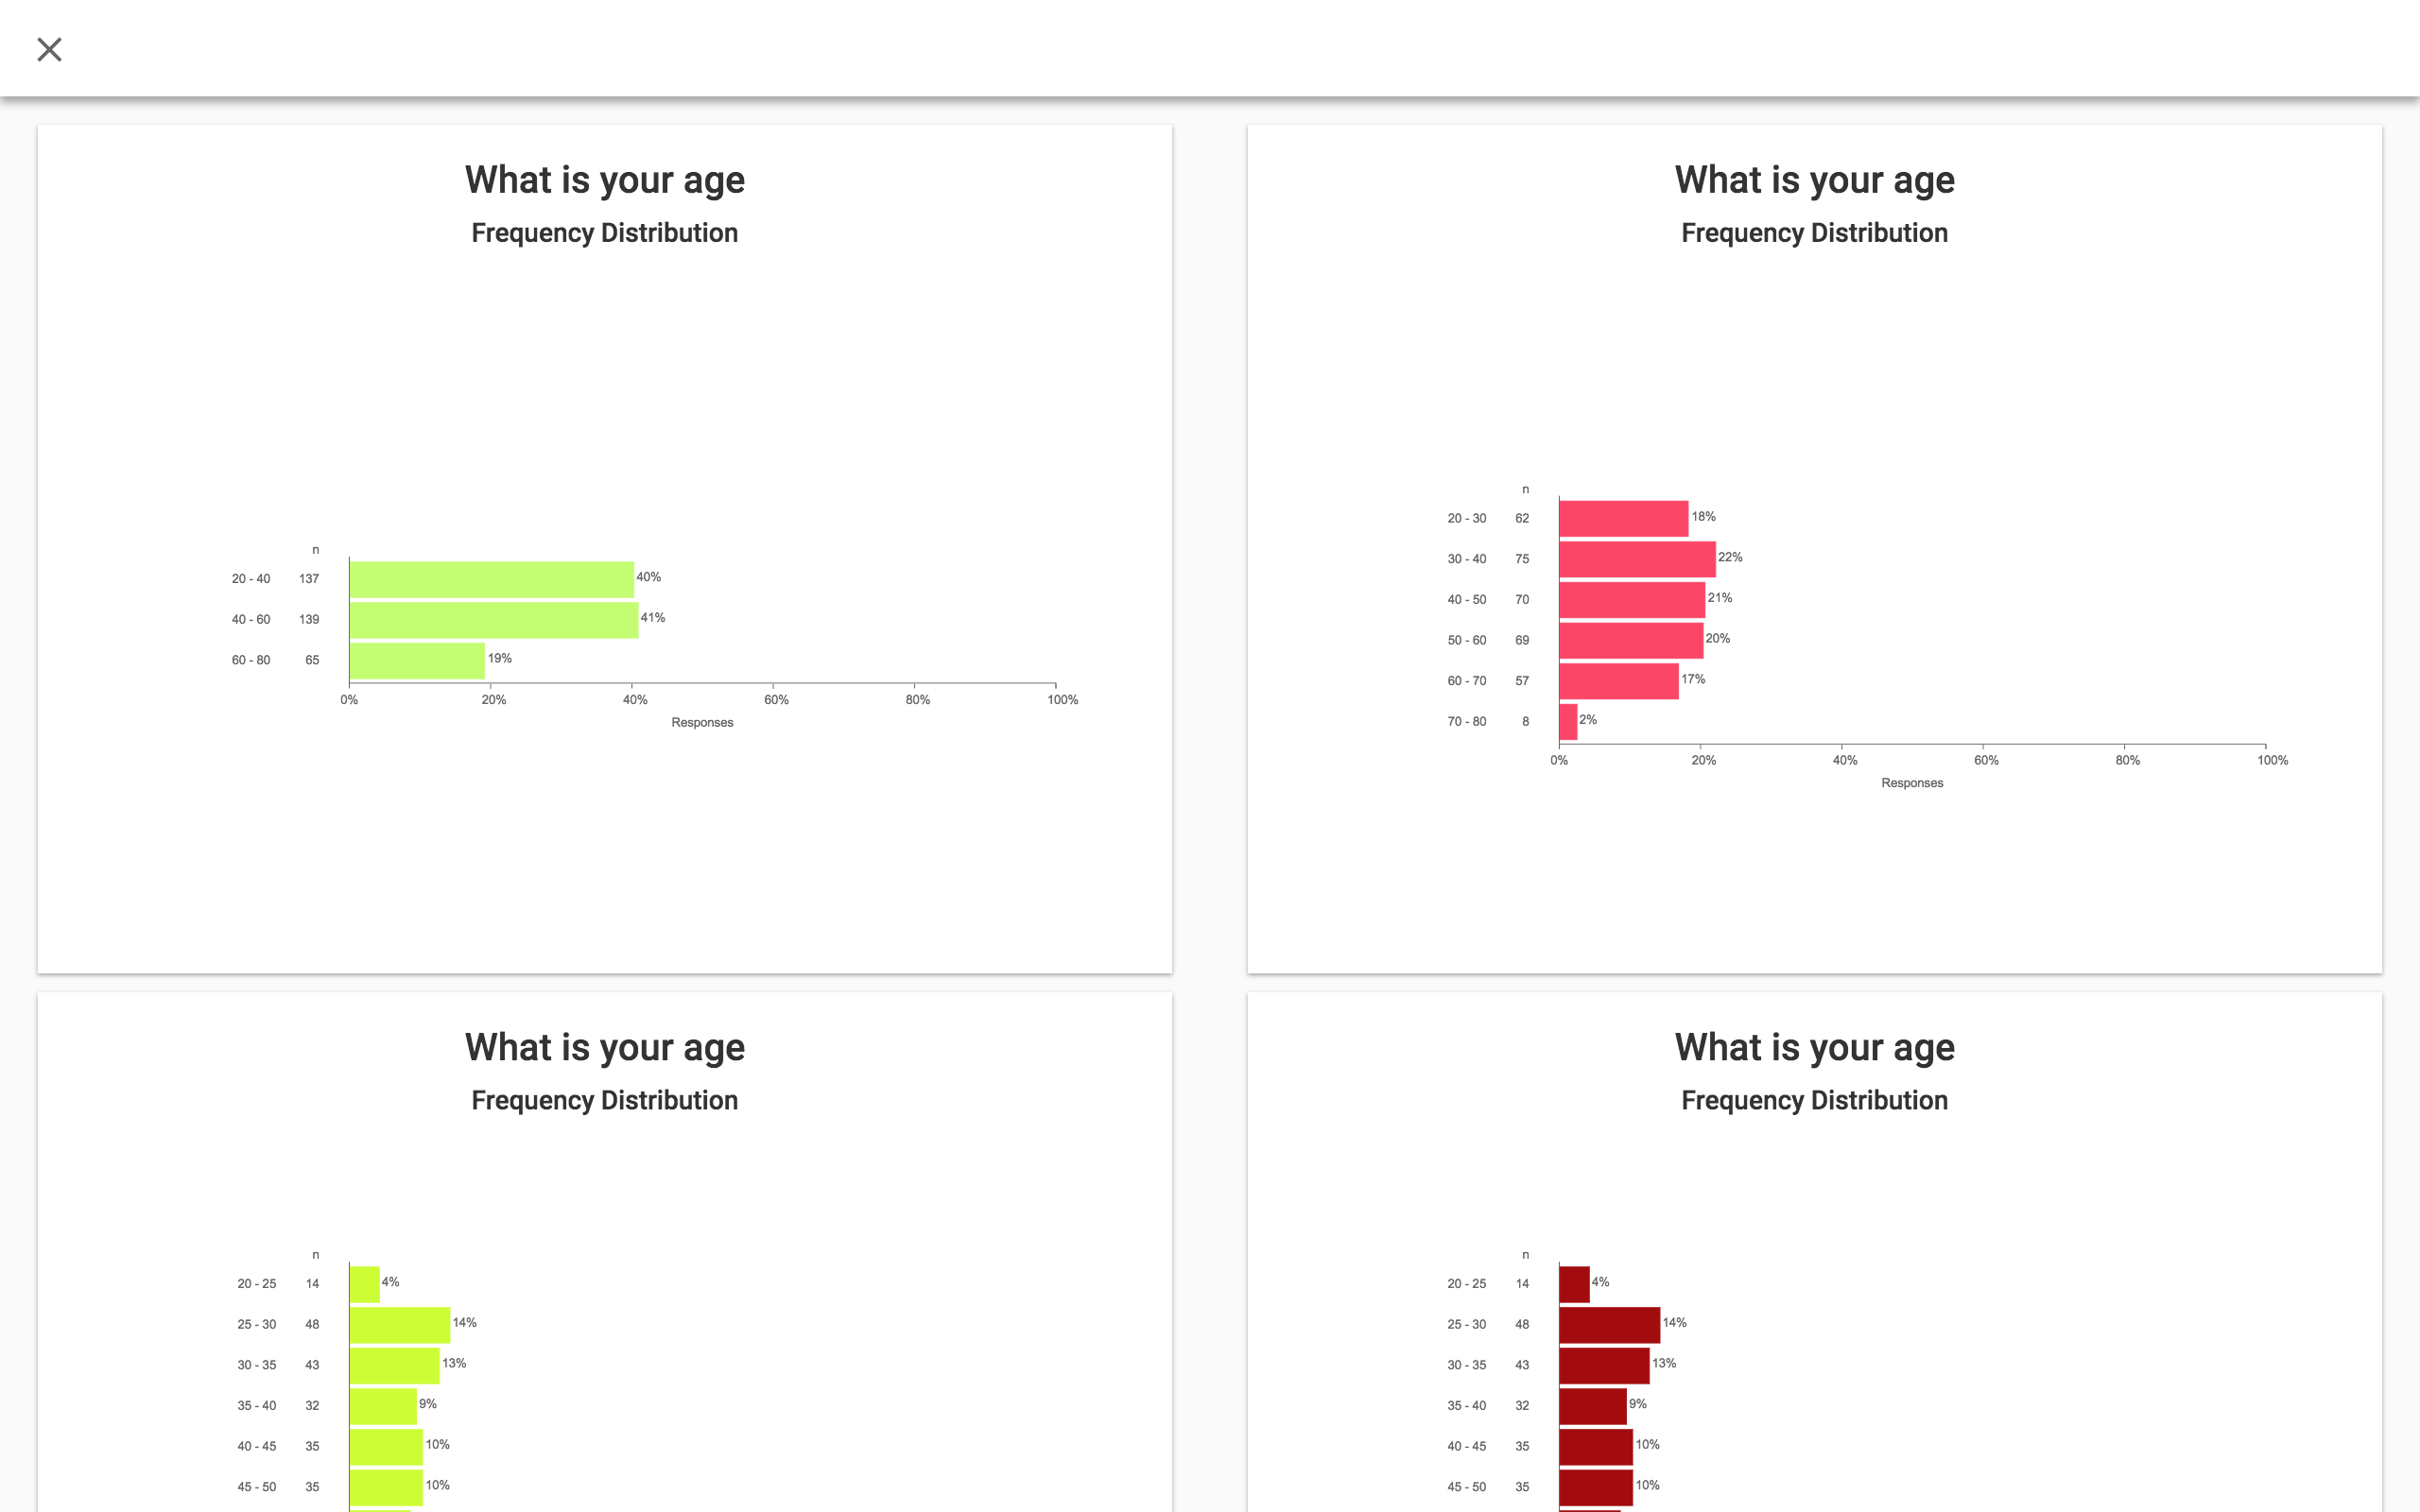
Bin numeric answers into
Frequency Distributions
So you can quickly see the largest, smallest and most or least important groups of respondents.
Get insights from
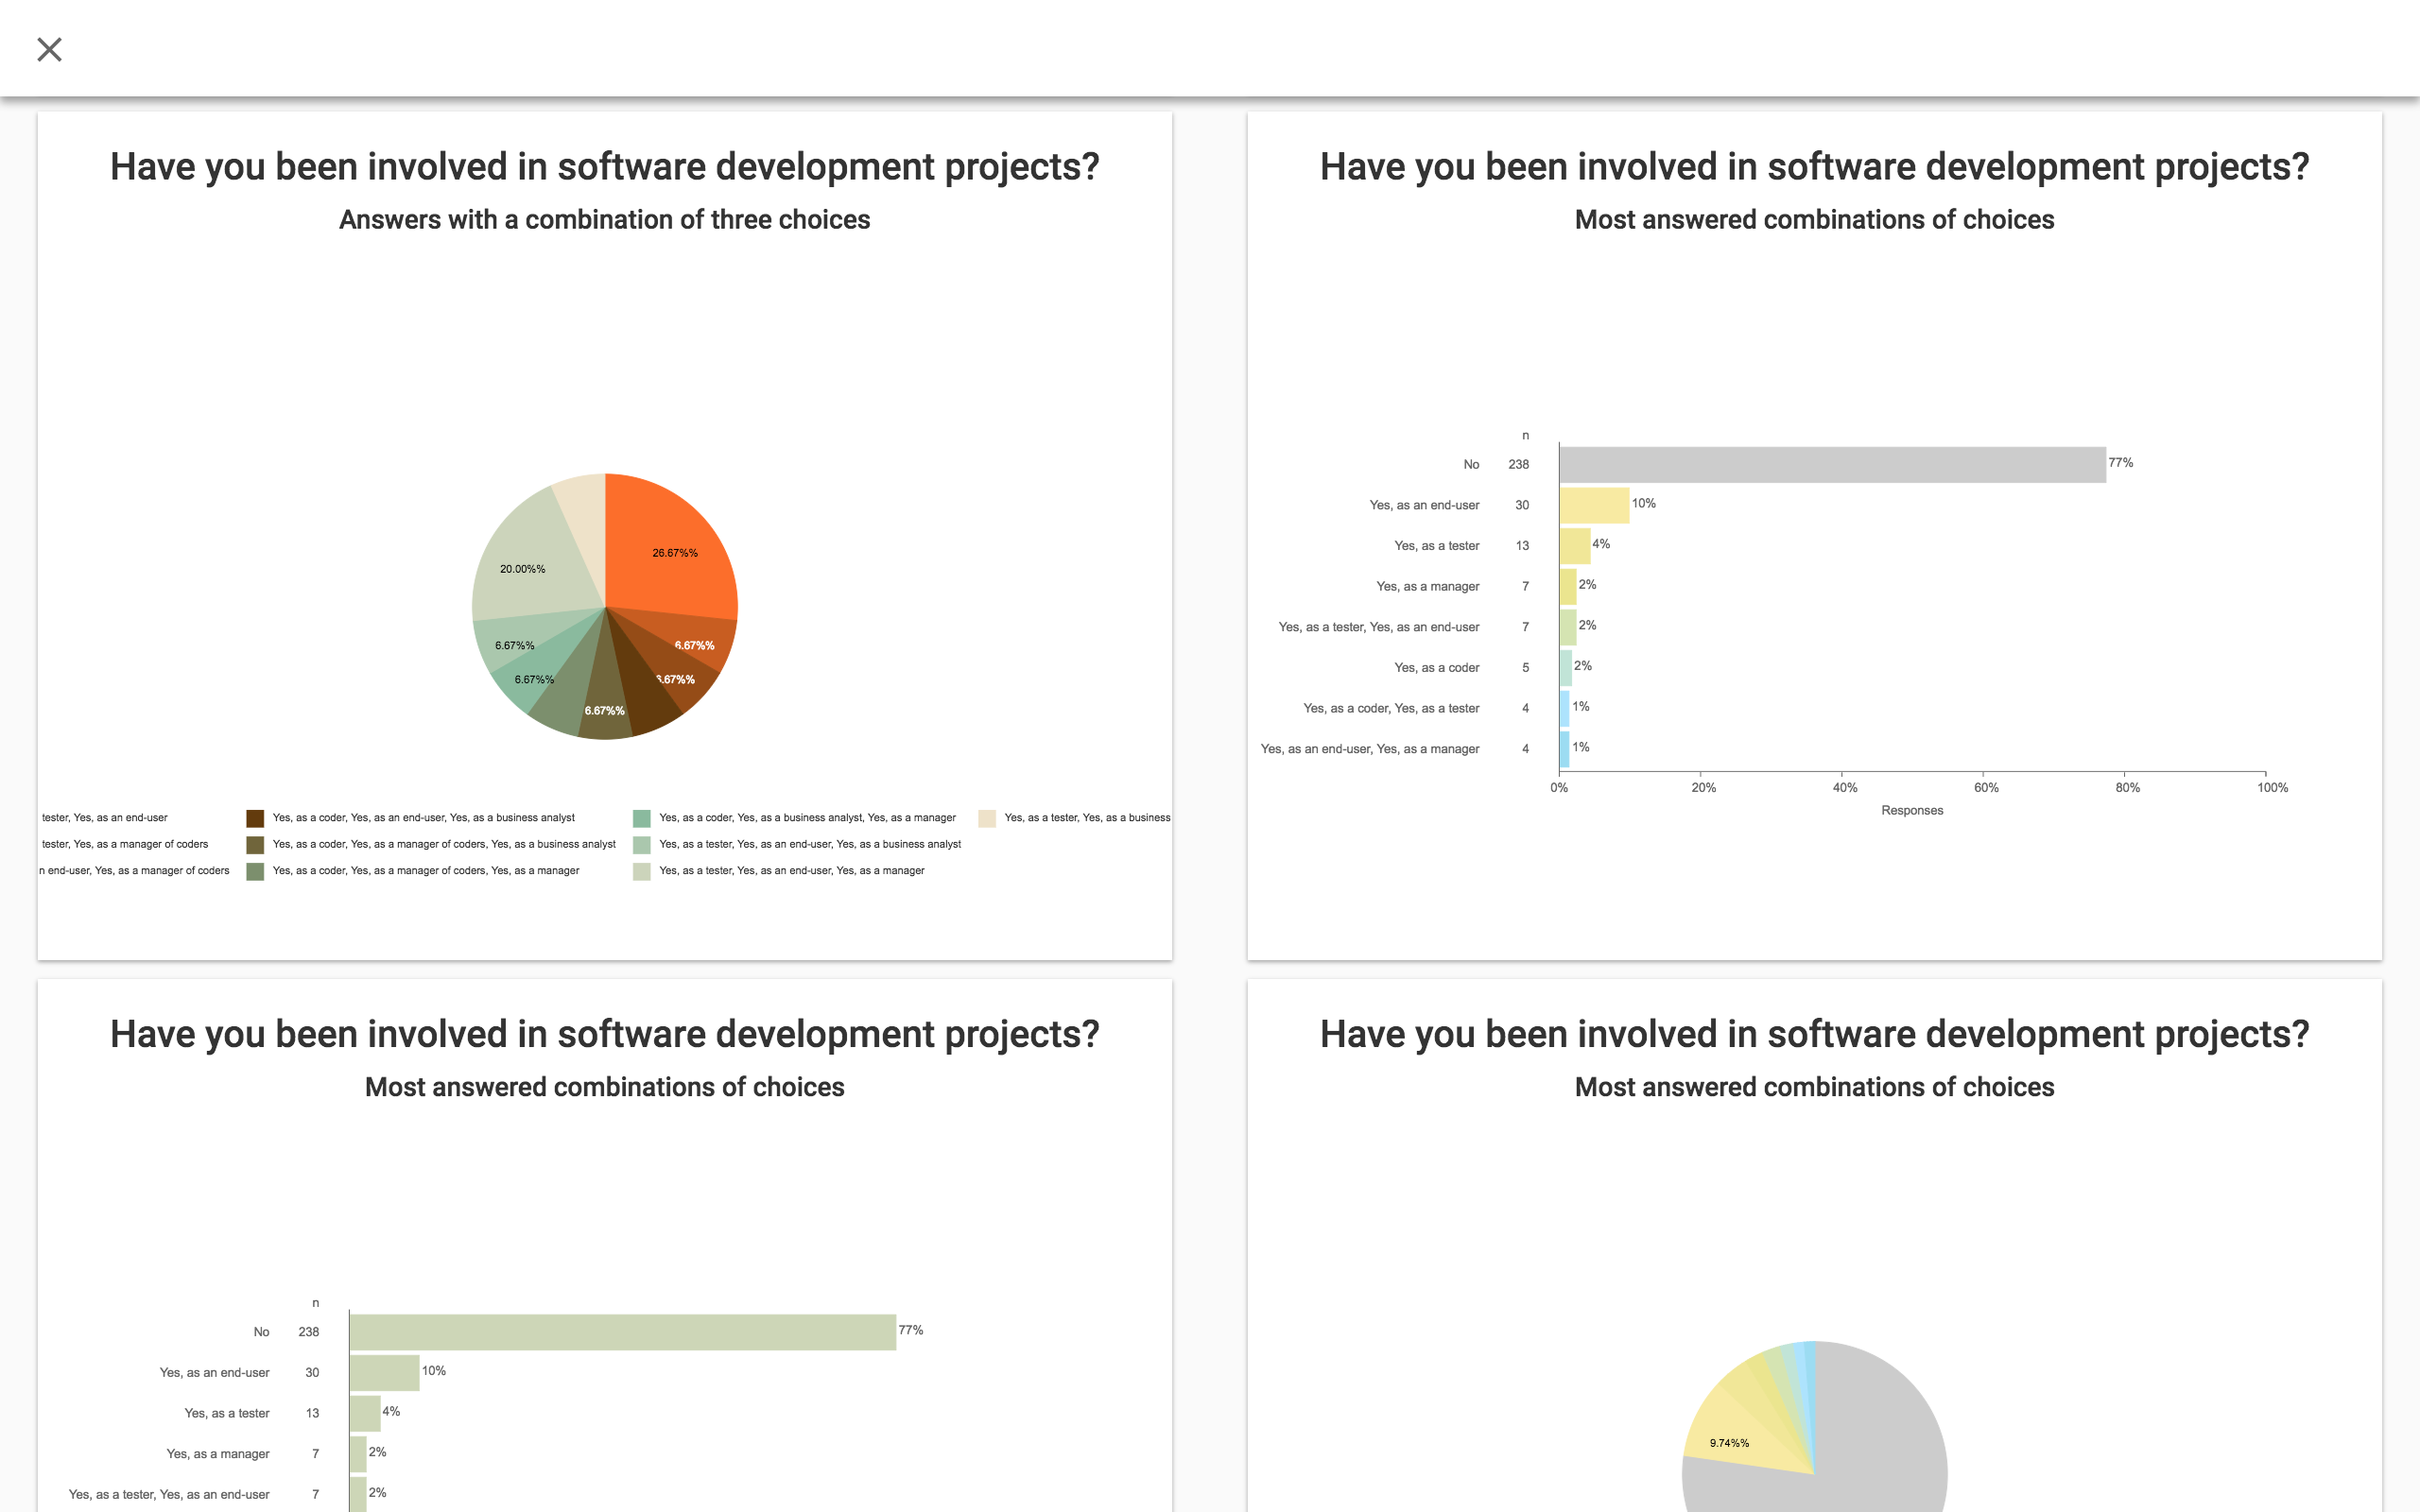
Choice Combinations
In multiple choice questions, respondents often select more than one choice. We show you popular choice combinations.
Work with the
Net Promoter Score
See your promotors and detractors without hassle. You can select promoters and detractors in filters.
Quantify short text answers with
Powerful Phrase Analysis
Our text phrase analysis is great for learning how many times certain popular phrases were mentioned.
Get insights from
Multiple Surveys At Once
You can create reports and dashboards based on multiple surveys.
Works great when you repeat the same survey for different audiences or on different times.

Made for Surveymonkey
At your fingertips
For all SurveyMonkey customers
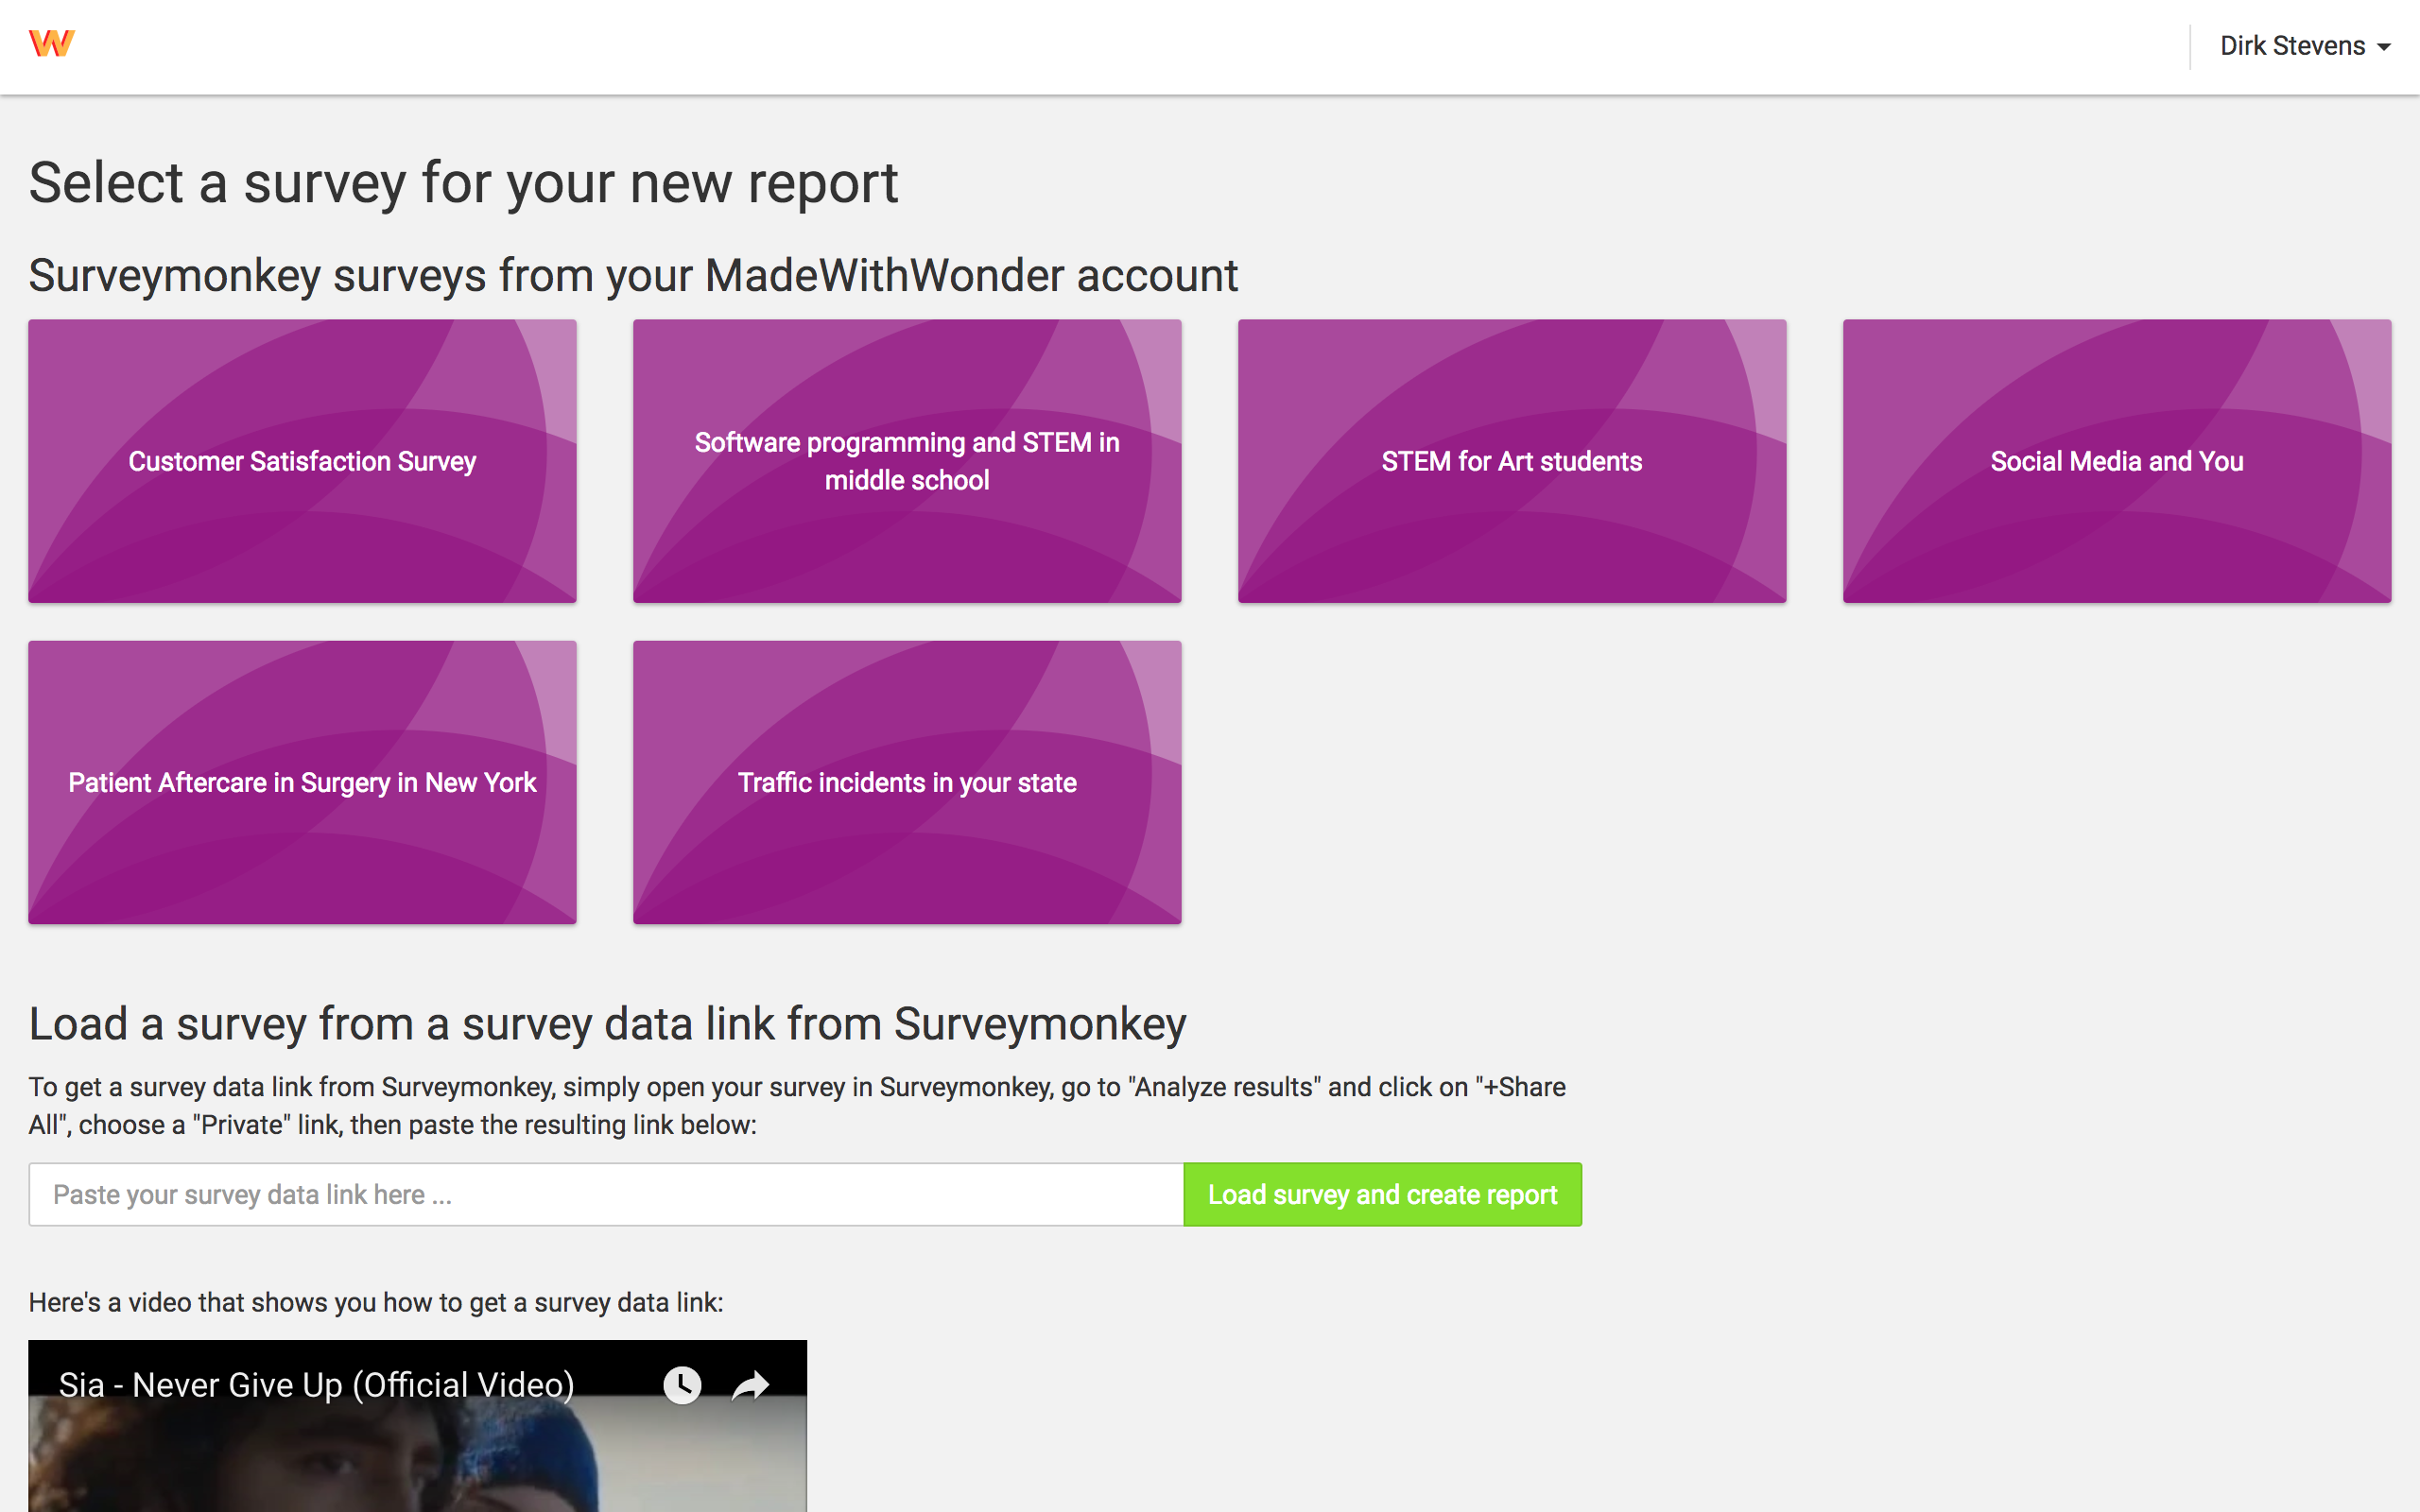
Load SurveyMonkey Data
Get a shared survey data link at SurveyMonkey and Surveywonders turns your survey data in a great report. In seconds.
Learn more about how to get a shared survey data link at SurveyMonkey here.
For paying SurveyMonkey customers
Direct Link With Surveymonkey
Connect your SurveyMonkey account and access all your surveys directly in Surveywonders. Creating reports has never been so easy.

Signup
Signup now, it's free
SignupWe have an always free plan and our premium plans come with first 30 days free.